Originalartikel
Backup
<html>
<div class=„vector-body-before-content“> </div> <div id=„mw-content-text“ class=„mw-body-content“><div class=„mw-content-ltr mw-parser-output“ lang=„en“ dir=„ltr“><p><b>Student's <i>t</i>-test</b> is a <a href=„https://en.wikipedia.org/wiki/Statistical_test“ class=„mw-redirect“ title=„Statistical test“>statistical test</a> used to test whether the difference between the response of two groups is <a href=„https://en.wikipedia.org/wiki/Statistical_significance“ title=„Statistical significance“>statistically significant</a> or not. It is any <a href=„https://en.wikipedia.org/wiki/Statistical_hypothesis_testing“ class=„mw-redirect“ title=„Statistical hypothesis testing“>statistical hypothesis test</a> in which the <a href=„https://en.wikipedia.org/wiki/Test_statistic“ title=„Test statistic“>test statistic</a> follows a <a href=„https://en.wikipedia.org/wiki/Student%27s_t-distribution“ title=„Student's t-distribution“>Student's <i>t</i>-distribution</a> under the <a href=„https://en.wikipedia.org/wiki/Null_hypothesis“ title=„Null hypothesis“>null hypothesis</a>. It is most commonly applied when the test statistic would follow a <a href=„https://en.wikipedia.org/wiki/Normal_distribution“ title=„Normal distribution“>normal distribution</a> if the value of a <a href=„https://en.wikipedia.org/wiki/Scale_parameter“ title=„Scale parameter“>scaling term</a> in the test statistic were known (typically, the scaling term is unknown and is therefore a <a href=„https://en.wikipedia.org/wiki/Nuisance_parameter“ title=„Nuisance parameter“>nuisance parameter</a>). When the scaling term is estimated based on the <a href=„https://en.wikipedia.org/wiki/Data“ title=„data“>data</a>, the test statistic—under certain conditions—follows a Student's <i>t</i> distribution. The <i>t</i>-test's most common application is to test whether the means of two populations are significantly different. In many cases, a <a href=„https://en.wikipedia.org/wiki/Z-test“ title=„Z-test“>Z-test</a> will yield very similar results to a t-test since the latter converges to the former as the size of the dataset increases.</p><h2>History[<a href=„https://en.wikipedia.org/w/index.php?title=Student%27s_t-test&action=edit&section=1“ title=„Edit section: History“>edit</a>]</h2><figure class=„mw-default-size“><a href=„https://en.wikipedia.org/wiki/File:William_Sealy_Gosset.jpg“ class=„mw-file-description“><img src=„https://upload.wikimedia.org/wikipedia/commons/thumb/4/42/William_Sealy_Gosset.jpg/170px-William_Sealy_Gosset.jpg“ width=„170“ height=„219“ class=„mw-file-element“ srcset=„upload.wikimedia.org/wikipedia/commons/thumb/4/42/William_Sealy_Gosset.jpg/255px-William_Sealy_Gosset.jpg 1.5x, upload.wikimedia.org/wikipedia/commons/thumb/4/42/William_Sealy_Gosset.jpg/340px-William_Sealy_Gosset.jpg 2x“ data-file-width=„2000“ data-file-height=„2577“ referrerpolicy=„no-referrer“ alt=„image“ /></a><figcaption><a href=„https://en.wikipedia.org/wiki/William_Sealy_Gosset“ title=„William Sealy Gosset“>William Sealy Gosset</a>, who developed the „<i>t</i>-statistic“ and published it under the <a href=„https://en.wikipedia.org/wiki/Pseudonym“ title=„Pseudonym“>pseudonym</a> of „Student“</figcaption></figure><p>The term „<i>t</i>-statistic“ is abbreviated from „hypothesis test statistic“.<sup id=„cite_ref-1“ class=„reference“><a href=„https://en.wikipedia.org/wiki/Student%27s_t-test#cite_note-1“>[1]</a></sup> In statistics, the <i>t</i>-distribution was first derived as a <a href=„https://en.wikipedia.org/wiki/Posterior_probability“ title=„Posterior probability“>posterior distribution</a> in 1876 by <a href=„https://en.wikipedia.org/wiki/Friedrich_Robert_Helmert“ title=„Friedrich Robert Helmert“>Helmert</a><sup id=„cite_ref-2“ class=„reference“><a href=„https://en.wikipedia.org/wiki/Student%27s_t-test#cite_note-2“>[2]</a></sup><sup id=„cite_ref-3“ class=„reference“><a href=„https://en.wikipedia.org/wiki/Student%27s_t-test#cite_note-3“>[3]</a></sup><sup id=„cite_ref-4“ class=„reference“><a href=„https://en.wikipedia.org/wiki/Student%27s_t-test#cite_note-4“>[4]</a></sup> and <a href=„https://en.wikipedia.org/wiki/Jacob_L%C3%BCroth“ title=„Jacob Lüroth“>Lüroth</a>.<sup id=„cite_ref-5“ class=„reference“><a href=„https://en.wikipedia.org/wiki/Student%27s_t-test#cite_note-5“>[5]</a></sup><sup id=„cite_ref-6“ class=„reference“><a href=„https://en.wikipedia.org/wiki/Student%27s_t-test#cite_note-6“>[6]</a></sup><sup id=„cite_ref-7“ class=„reference“><a href=„https://en.wikipedia.org/wiki/Student%27s_t-test#cite_note-7“>[7]</a></sup> The <i>t</i>-distribution also appeared in a more general form as Pearson type <a href=„https://en.wikipedia.org/wiki/Pearson_distribution“ title=„Pearson distribution“>IV</a> distribution in <a href=„https://en.wikipedia.org/wiki/Karl_Pearson“ title=„Karl Pearson“>Karl Pearson</a>'s 1895 paper.<sup id=„cite_ref-8“ class=„reference“><a href=„https://en.wikipedia.org/wiki/Student%27s_t-test#cite_note-8“>[8]</a></sup> However, the <i>t</i>-distribution, also known as <a href=„https://en.wikipedia.org/wiki/Student%27s_t-distribution“ title=„Student's t-distribution“>Student's <i>t</i>-distribution</a>, gets its name from <a href=„https://en.wikipedia.org/wiki/William_Sealy_Gosset“ title=„William Sealy Gosset“>William Sealy Gosset</a>, who first published it in English in 1908 in the scientific journal <a href=„https://en.wikipedia.org/wiki/Biometrika“ title=„Biometrika“>Biometrika</a> using the pseudonym „Student“<sup id=„cite_ref-The_Probable_Error_of_a_Mean_9-0“ class=„reference“><a href=„https://en.wikipedia.org/wiki/Student%27s_t-test#cite_note-The_Probable_Error_of_a_Mean-9“>[9]</a></sup><sup id=„cite_ref-10“ class=„reference“><a href=„https://en.wikipedia.org/wiki/Student%27s_t-test#cite_note-10“>[10]</a></sup> because his employer preferred staff to use <a href=„https://en.wikipedia.org/wiki/Pen_name“ title=„Pen name“>pen names</a> when publishing scientific papers.<sup id=„cite_ref-11“ class=„reference“><a href=„https://en.wikipedia.org/wiki/Student%27s_t-test#cite_note-11“>[11]</a></sup> Gosset worked at the <a href=„https://en.wikipedia.org/wiki/Guinness_Brewery“ title=„Guinness Brewery“>Guinness Brewery</a> in <a href=„https://en.wikipedia.org/wiki/Dublin“ title=„Dublin“>Dublin</a>, <a href=„https://en.wikipedia.org/wiki/Ireland“ title=„Ireland“>Ireland</a>, and was interested in the problems of small samples – for example, the chemical properties of barley with small sample sizes. Hence a second version of the etymology of the term Student is that Guinness did not want their competitors to know that they were using the <i>t</i>-test to determine the quality of raw material. Although it was William Gosset after whom the term „Student“ is penned, it was actually through the work of <a href=„https://en.wikipedia.org/wiki/Ronald_Fisher“ title=„Ronald Fisher“>Ronald Fisher</a> that the distribution became well known as „Student's distribution“<sup id=„cite_ref-12“ class=„reference“><a href=„https://en.wikipedia.org/wiki/Student%27s_t-test#cite_note-12“>[12]</a></sup> and „Student's <i>t</i>-test“.</p><p>Gosset devised the <i>t</i>-test as an economical way to monitor the quality of <a href=„https://en.wikipedia.org/wiki/Stout“ title=„Stout“>stout</a>. The <i>t</i>-test work was submitted to and accepted in the journal <i><a href=„https://en.wikipedia.org/wiki/Biometrika“ title=„Biometrika“>Biometrika</a></i> and published in 1908.<sup id=„cite_ref-The_Probable_Error_of_a_Mean_9-1“ class=„reference“><a href=„https://en.wikipedia.org/wiki/Student%27s_t-test#cite_note-The_Probable_Error_of_a_Mean-9“>[9]</a></sup></p><p>Guinness had a policy of allowing technical staff leave for study (so-called „study leave“), which Gosset used during the first two terms of the 1906–1907 academic year in Professor <a href=„https://en.wikipedia.org/wiki/Karl_Pearson“ title=„Karl Pearson“>Karl Pearson</a>'s Biometric Laboratory at <a href=„https://en.wikipedia.org/wiki/University_College_London“ title=„University College London“>University College London</a>.<sup id=„cite_ref-13“ class=„reference“><a href=„https://en.wikipedia.org/wiki/Student%27s_t-test#cite_note-13“>[13]</a></sup> Gosset's identity was then known to fellow statisticians and to editor-in-chief Karl Pearson.<sup id=„cite_ref-Dodge2008_14-0“ class=„reference“><a href=„https://en.wikipedia.org/wiki/Student%27s_t-test#cite_note-Dodge2008-14“>[14]</a></sup></p><h2>Uses[<a href=„https://en.wikipedia.org/w/index.php?title=Student%27s_t-test&action=edit&section=2“ title=„Edit section: Uses“>edit</a>]</h2><figure class=„mw-default-size mw-halign-right“><a href=„https://en.wikipedia.org/wiki/File:One_sample_t-test.png“ class=„mw-file-description“><img src=„https://upload.wikimedia.org/wikipedia/commons/thumb/1/1b/One_sample_t-test.png/220px-One_sample_t-test.png“ width=„220“ height=„147“ class=„mw-file-element“ srcset=„upload.wikimedia.org/wikipedia/commons/thumb/1/1b/One_sample_t-test.png/330px-One_sample_t-test.png 1.5x, upload.wikimedia.org/wikipedia/commons/thumb/1/1b/One_sample_t-test.png/440px-One_sample_t-test.png 2x“ data-file-width=„953“ data-file-height=„637“ referrerpolicy=„no-referrer“ alt=„image“ /></a></figure><figure class=„mw-default-size mw-halign-right“><a href=„https://en.wikipedia.org/wiki/File:2_Sample_Test.png“ class=„mw-file-description“><img src=„https://upload.wikimedia.org/wikipedia/commons/thumb/1/1c/2_Sample_Test.png/220px-2_Sample_Test.png“ width=„220“ height=„134“ class=„mw-file-element“ srcset=„upload.wikimedia.org/wikipedia/commons/thumb/1/1c/2_Sample_Test.png/330px-2_Sample_Test.png 1.5x, upload.wikimedia.org/wikipedia/commons/thumb/1/1c/2_Sample_Test.png/440px-2_Sample_Test.png 2x“ data-file-width=„982“ data-file-height=„597“ referrerpolicy=„no-referrer“ alt=„image“ /></a></figure><h3>One-sample t-test[<a href=„https://en.wikipedia.org/w/index.php?title=Student%27s_t-test&action=edit&section=3“ title=„Edit section: One-sample t-test“>edit</a>]</h3><p>A <b>one-sample Student's t-test</b> is a <a href=„https://en.wikipedia.org/wiki/Location_test“ title=„Location test“>location test</a> of whether the mean of a population has a value specified in a <a href=„https://en.wikipedia.org/wiki/Null_hypothesis“ title=„Null hypothesis“>null hypothesis</a>. In testing the null hypothesis that the population mean is equal to a specified value <i>μ</i>0, one uses the statistic</p><dl><dd><img src=„https://wikimedia.org/api/rest_v1/media/math/render/svg/db29c222725c5b8101aaf20d810bd06ed059dcab“ class=„mwe-math-fallback-image-inline mw-invert skin-invert“ aria-hidden=„true“ alt=„{\displaystyle t={\frac bar_x-\mu _{0}}{s/{\sqrt {n}}}},}“ referrerpolicy=„no-referrer“ /></dd></dl><p>where <img src=„https://wikimedia.org/api/rest_v1/media/math/render/svg/466e03e1c9533b4dab1b9949dad393883f385d80“ class=„mwe-math-fallback-image-inline mw-invert skin-invert“ aria-hidden=„true“ alt=„{\displaystyle {\bar {x}}}“ referrerpolicy=„no-referrer“ /> is the sample mean, <i>s</i> is the <a href=„https://en.wikipedia.org/wiki/Standard_deviation#Estimation“ title=„Standard deviation“>sample standard deviation</a> and <i>n</i> is the sample size. The degrees of freedom used in this test are <i>n</i> − 1. Although the parent population does not need to be normally distributed, the distribution of the population of sample means <img src=„https://wikimedia.org/api/rest_v1/media/math/render/svg/466e03e1c9533b4dab1b9949dad393883f385d80“ class=„mwe-math-fallback-image-inline mw-invert skin-invert“ aria-hidden=„true“ alt=„{\displaystyle {\bar {x}}}“ referrerpolicy=„no-referrer“ /> is assumed to be normal.</p><p>By the <a href=„https://en.wikipedia.org/wiki/Central_limit_theorem“ title=„Central limit theorem“>central limit theorem</a>, if the observations are independent and the second moment exists, then <img src=„https://wikimedia.org/api/rest_v1/media/math/render/svg/65658b7b223af9e1acc877d848888ecdb4466560“ class=„mwe-math-fallback-image-inline mw-invert skin-invert“ aria-hidden=„true“ alt=„{\displaystyle t}“ referrerpolicy=„no-referrer“ /> will be approximately normal <img src=„https://wikimedia.org/api/rest_v1/media/math/render/svg/8ba37ff02211fb81c813065b489b78ec9df951e7“ class=„mwe-math-fallback-image-inline mw-invert skin-invert“ aria-hidden=„true“ alt=„{\textstyle {\mathcal {N}}(0,1)}“ referrerpolicy=„no-referrer“ />.</p><h3>Two-sample <i>t</i>-tests[<a href=„https://en.wikipedia.org/w/index.php?title=Student%27s_t-test&action=edit&section=4“ title=„Edit section: Two-sample t-tests“>edit</a>]</h3><figure class=„mw-default-size“><a href=„https://en.wikipedia.org/wiki/File:Type_1_error.png“ class=„mw-file-description“><img src=„https://upload.wikimedia.org/wikipedia/commons/thumb/c/c8/Type_1_error.png/220px-Type_1_error.png“ width=„220“ height=„160“ class=„mw-file-element“ srcset=„upload.wikimedia.org/wikipedia/commons/thumb/c/c8/Type_1_error.png/330px-Type_1_error.png 1.5x, upload.wikimedia.org/wikipedia/commons/thumb/c/c8/Type_1_error.png/440px-Type_1_error.png 2x“ data-file-width=„598“ data-file-height=„435“ referrerpolicy=„no-referrer“ alt=„image“ /></a><figcaption>Type I error of unpaired and paired two-sample <i>t</i>-tests as a function of the correlation. The simulated random numbers originate from a bivariate normal distribution with a variance of 1. The significance level is 5% and the number of cases is 60.</figcaption></figure><figure class=„mw-default-size“><a href=„https://en.wikipedia.org/wiki/File:Power_of_t-tests.png“ class=„mw-file-description“><img src=„https://upload.wikimedia.org/wikipedia/commons/thumb/5/57/Power_of_t-tests.png/220px-Power_of_t-tests.png“ width=„220“ height=„160“ class=„mw-file-element“ srcset=„upload.wikimedia.org/wikipedia/commons/thumb/5/57/Power_of_t-tests.png/330px-Power_of_t-tests.png 1.5x, upload.wikimedia.org/wikipedia/commons/thumb/5/57/Power_of_t-tests.png/440px-Power_of_t-tests.png 2x“ data-file-width=„598“ data-file-height=„435“ referrerpolicy=„no-referrer“ alt=„image“ /></a><figcaption>Power of unpaired and paired two-sample <i>t</i>-tests as a function of the correlation. The simulated random numbers originate from a bivariate normal distribution with a variance of 1 and a deviation of the expected value of 0.4. The significance level is 5% and the number of cases is 60.</figcaption></figure><p>A <b>two-sample</b> location test of the null hypothesis such that the <a href=„https://en.wikipedia.org/wiki/Expected_value“ title=„Expected value“>means</a> of two populations are equal. All such tests are usually called <b>Student's <i>t</i>-tests</b>, though strictly speaking that name should only be used if the <a href=„https://en.wikipedia.org/wiki/Variance“ title=„Variance“>variances</a> of the two populations are also assumed to be equal; the form of the test used when this assumption is dropped is sometimes called <a href=„https://en.wikipedia.org/wiki/Welch%27s_t_test“ class=„mw-redirect“ title=„Welch's t test“>Welch's <i>t</i>-test</a>. These tests are often referred to as <b>unpaired</b> or <i>independent samples</i> <i>t</i>-tests, as they are typically applied when the <a href=„https://en.wikipedia.org/wiki/Unit_(statistics)“ class=„mw-redirect“ title=„Unit (statistics)“>statistical units</a> underlying the two samples being compared are non-overlapping.<sup id=„cite_ref-fadem_15-0“ class=„reference“><a href=„https://en.wikipedia.org/wiki/Student%27s_t-test#cite_note-fadem-15“>[15]</a></sup></p><p>Two-sample <i>t</i>-tests for a difference in means involve independent samples (unpaired samples) or <a href=„https://en.wikipedia.org/wiki/Paired_sample“ class=„mw-redirect“ title=„Paired sample“>paired samples</a>. Paired <i>t</i>-tests are a form of <a href=„https://en.wikipedia.org/wiki/Blocking_(statistics)“ title=„Blocking (statistics)“>blocking</a>, and have greater <a href=„https://en.wikipedia.org/wiki/Statistical_power“ class=„mw-redirect“ title=„Statistical power“>power</a> (probability of avoiding a type II error, also known as a false negative) than unpaired tests when the paired units are similar with respect to „noise factors“ (see <a href=„https://en.wikipedia.org/wiki/Confounder“ class=„mw-redirect“ title=„Confounder“>confounder</a>) that are independent of membership in the two groups being compared.<sup id=„cite_ref-16“ class=„reference“><a href=„https://en.wikipedia.org/wiki/Student%27s_t-test#cite_note-16“>[16]</a></sup> In a different context, paired <i>t</i>-tests can be used to reduce the effects of <a href=„https://en.wikipedia.org/wiki/Confounders“ class=„mw-redirect“ title=„Confounders“>confounding factors</a> in an <a href=„https://en.wikipedia.org/wiki/Observational_study“ title=„Observational study“>observational study</a>.</p><h4>Independent (unpaired) samples[<a href=„https://en.wikipedia.org/w/index.php?title=Student%27s_t-test&action=edit&section=5“ title=„Edit section: Independent (unpaired) samples“>edit</a>]</h4><p>The independent samples <i>t</i>-test is used when two separate sets of <a href=„https://en.wikipedia.org/wiki/Independent_and_identically-distributed_random_variables“ class=„mw-redirect“ title=„Independent and identically-distributed random variables“>independent and identically distributed</a> samples are obtained, and one variable from each of the two populations is compared. For example, suppose we are evaluating the effect of a medical treatment, and we enroll 100 subjects into our study, then randomly assign 50 subjects to the treatment group and 50 subjects to the control group. In this case, we have two independent samples and would use the unpaired form of the <i>t</i>-test.</p><h4>Paired samples[<a href=„https://en.wikipedia.org/w/index.php?title=Student%27s_t-test&action=edit&section=6“ title=„Edit section: Paired samples“>edit</a>]</h4><style data-mw-deduplicate=„TemplateStyles:r1033289096“ scoped=„scoped“></style><div role=„note“ class=„hatnote navigation-not-searchable“>Main article: <a href=„https://en.wikipedia.org/wiki/Paired_difference_test“ title=„Paired difference test“>Paired difference test</a></div><p><a href=„https://en.wikipedia.org/wiki/Paired_sample“ class=„mw-redirect“ title=„Paired sample“>Paired samples</a> <i>t</i>-tests typically consist of a sample of matched pairs of similar <a href=„https://en.wikipedia.org/wiki/Unit_(statistics)“ class=„mw-redirect“ title=„Unit (statistics)“>units</a>, or one group of units that has been tested twice (a „repeated measures“ <i>t</i>-test).</p><p>A typical example of the repeated measures <i>t</i>-test would be where subjects are tested prior to a treatment, say for high blood pressure, and the same subjects are tested again after treatment with a blood-pressure-lowering medication. By comparing the same patient's numbers before and after treatment, we are effectively using each patient as their own control. That way the correct rejection of the null hypothesis (here: of no difference made by the treatment) can become much more likely, with statistical power increasing simply because the random interpatient variation has now been eliminated. However, an increase of statistical power comes at a price: more tests are required, each subject having to be tested twice. Because half of the sample now depends on the other half, the paired version of Student's <i>t</i>-test has only </p><style data-mw-deduplicate=„TemplateStyles:r1214402035“ scoped=„scoped“></style><i>n</i>/2 − 1 degrees of freedom (with <i>n</i> being the total number of observations). Pairs become individual test units, and the sample has to be doubled to achieve the same number of degrees of freedom. Normally, there are <i>n</i> − 1 degrees of freedom (with <i>n</i> being the total number of observations).<sup id=„cite_ref-17“ class=„reference“><a href=„https://en.wikipedia.org/wiki/Student%27s_t-test#cite_note-17“>[17]</a></sup><p>A paired samples <i>t</i>-test based on a „matched-pairs sample“ results from an unpaired sample that is subsequently used to form a paired sample, by using additional variables that were measured along with the variable of interest.<sup id=„cite_ref-18“ class=„reference“><a href=„https://en.wikipedia.org/wiki/Student%27s_t-test#cite_note-18“>[18]</a></sup> The matching is carried out by identifying pairs of values consisting of one observation from each of the two samples, where the pair is similar in terms of other measured variables. This approach is sometimes used in observational studies to reduce or eliminate the effects of confounding factors.</p><p>Paired samples <i>t</i>-tests are often referred to as „dependent samples <i>t</i>-tests“.</p><h2>Assumptions[<a href=„https://en.wikipedia.org/w/index.php?title=Student%27s_t-test&action=edit&section=7“ title=„Edit section: Assumptions“>edit</a>]</h2><p></p><p>Most test statistics have the form <i>t</i> = <i>Z</i>/<i>s</i>, where <i>Z</i> and <i>s</i> are functions of the data.</p><p><i>Z</i> may be sensitive to the alternative hypothesis (i.e., its magnitude tends to be larger when the alternative hypothesis is true), whereas <i>s</i> is a <a href=„https://en.wikipedia.org/wiki/Scale_parameter“ title=„Scale parameter“>scaling parameter</a> that allows the distribution of <i>t</i> to be determined.</p><p>As an example, in the one-sample <i>t</i>-test</p><dl><dd><img src=„https://wikimedia.org/api/rest_v1/media/math/render/svg/38cb5f371040e73042d1a939baa5eef4d44b64ca“ class=„mwe-math-fallback-image-inline mw-invert skin-invert“ aria-hidden=„true“ alt=„{\displaystyle t={\frac {Z}{s}}={\frac bar_x-\mu }hat_sigma/{\sqrt {n}}}},}“ referrerpolicy=„no-referrer“ /></dd></dl><p>where <img src=„https://wikimedia.org/api/rest_v1/media/math/render/svg/90b968141b314f4de17f5e63f18dcdc126352bac“ class=„mwe-math-fallback-image-inline mw-invert skin-invert“ aria-hidden=„true“ alt=„{\displaystyle {\bar {X}}}“ referrerpolicy=„no-referrer“ /> is the <a href=„https://en.wikipedia.org/wiki/Sample_mean“ class=„mw-redirect“ title=„Sample mean“>sample mean</a> from a sample <i>X</i>1, <i>X</i>2, …, <i>X</i><i>n</i>, of size <i>n</i>, <i>s</i> is the <a href=„https://en.wikipedia.org/wiki/Standard_error_of_the_mean“ class=„mw-redirect“ title=„Standard error of the mean“>standard error of the mean</a>, <img src=„https://wikimedia.org/api/rest_v1/media/math/render/svg/a5e5c57bc0eccb19f4311d029fc1234617be6004“ class=„mwe-math-fallback-image-inline mw-invert skin-invert“ aria-hidden=„true“ alt=„{\displaystyle {\hat {\sigma }}={\sqrt frac_1_n-1\sum _{i}(X_{i}-{\bar {X}})^{2}}}}“ referrerpolicy=„no-referrer“ /> is the estimate of the <a href=„https://en.wikipedia.org/wiki/Variance“ title=„Variance“>standard deviation</a> of the population, and <i>μ</i> is the <a href=„https://en.wikipedia.org/wiki/Population_mean“ class=„mw-redirect“ title=„Population mean“>population mean</a>.</p><p>The assumptions underlying a <i>t</i>-test in the simplest form above are that:</p><ul><li><i>X</i> follows a normal distribution with mean <i>μ</i> and variance <i>σ</i>2/<i>n</i>.</li><li><i>s</i>2(<i>n</i> − 1)/<i>σ</i>2 follows a <a href=„https://en.wikipedia.org/wiki/Chi-squared_distribution“ title=„Chi-squared distribution“><i>χ</i>2 distribution</a> with <i>n</i> − 1 <a href=„https://en.wikipedia.org/wiki/Degrees_of_freedom_(statistics)“ title=„Degrees of freedom (statistics)“>degrees of freedom</a>. This assumption is met when the observations used for estimating <i>s</i>2 come from a normal distribution (and <a href=„https://en.wikipedia.org/wiki/I.i.d.“ class=„mw-redirect“ title=„I.i.d.“>i.i.d.</a> for each group).</li><li><i>Z</i> and <i>s</i> are <a href=„https://en.wikipedia.org/wiki/Statistical_independence“ class=„mw-redirect“ title=„Statistical independence“>independent</a>.</li></ul><p>In the <i>t</i>-test comparing the means of two independent samples, the following assumptions should be met:</p><ul><li>The means of the two populations being compared should follow <a href=„https://en.wikipedia.org/wiki/Normal_distributions“ class=„mw-redirect“ title=„Normal distributions“>normal distributions</a>. Under weak assumptions, this follows in large samples from the <a href=„https://en.wikipedia.org/wiki/Central_limit_theorem“ title=„Central limit theorem“>central limit theorem</a>, even when the distribution of observations in each group is non-normal.<sup id=„cite_ref-:0_19-0“ class=„reference“><a href=„https://en.wikipedia.org/wiki/Student%27s_t-test#cite_note-:0-19“>[19]</a></sup></li><li>If using Student's original definition of the <i>t</i>-test, the two populations being compared should have the same variance (testable using <a href=„https://en.wikipedia.org/wiki/F-test_of_equality_of_variances“ title=„F-test of equality of variances“><i>F</i>-test</a>, <a href=„https://en.wikipedia.org/wiki/Levene%27s_test“ title=„Levene's test“>Levene's test</a>, <a href=„https://en.wikipedia.org/wiki/Bartlett%27s_test“ title=„Bartlett's test“>Bartlett's test</a>, or the <a href=„https://en.wikipedia.org/wiki/Brown%E2%80%93Forsythe_test“ title=„Brown–Forsythe test“>Brown–Forsythe test</a>; or assessable graphically using a <a href=„https://en.wikipedia.org/wiki/Q%E2%80%93Q_plot“ title=„Q–Q plot“>Q–Q plot</a>). If the sample sizes in the two groups being compared are equal, Student's original <i>t</i>-test is highly robust to the presence of unequal variances.<sup id=„cite_ref-20“ class=„reference“><a href=„https://en.wikipedia.org/wiki/Student%27s_t-test#cite_note-20“>[20]</a></sup><a href=„https://en.wikipedia.org/wiki/Welch%27s_t-test“ title=„Welch's t-test“>Welch's <i>t</i>-test</a> is insensitive to equality of the variances regardless of whether the sample sizes are similar.</li><li>The data used to carry out the test should either be sampled independently from the two populations being compared or be fully paired. This is in general not testable from the data, but if the data are known to be dependent (e.g. paired by test design), a dependent test has to be applied. For partially paired data, the classical independent <i>t</i>-tests may give invalid results as the test statistic might not follow a <i>t</i> distribution, while the dependent <i>t</i>-test is sub-optimal as it discards the unpaired data.<sup id=„cite_ref-Guo2017_21-0“ class=„reference“><a href=„https://en.wikipedia.org/wiki/Student%27s_t-test#cite_note-Guo2017-21“>[21]</a></sup></li></ul><p>Most two-sample <i>t</i>-tests are robust to all but large deviations from the assumptions.<sup id=„cite_ref-Bland1995_22-0“ class=„reference“><a href=„https://en.wikipedia.org/wiki/Student%27s_t-test#cite_note-Bland1995-22“>[22]</a></sup></p><p>For <a href=„https://en.wikipedia.org/wiki/Exact_test“ title=„Exact test“>exactness</a>, the <i>t</i>-test and <i>Z</i>-test require normality of the sample means, and the <i>t</i>-test additionally requires that the sample variance follows a scaled <a href=„https://en.wikipedia.org/wiki/Chi-squared_distribution“ title=„Chi-squared distribution“><i>χ</i>2 distribution</a>, and that the sample mean and sample variance be <a href=„https://en.wikipedia.org/wiki/Independence_(probability_theory)“ title=„Independence (probability theory)“>statistically independent</a>. Normality of the individual data values is not required if these conditions are met. By the <a href=„https://en.wikipedia.org/wiki/Central_limit_theorem“ title=„Central limit theorem“>central limit theorem</a>, sample means of moderately large samples are often well-approximated by a normal distribution even if the data are not normally distributed. However, the sample size required for the sample means to converge to normality depends on the skewness of the distribution of the original data. The sample can vary from 30 to 100 or higher values depending on the skewness.<sup id=„cite_ref-23“ class=„reference“><a href=„https://en.wikipedia.org/wiki/Student%27s_t-test#cite_note-23“>[23]</a></sup><sup id=„cite_ref-24“ class=„reference“><a href=„https://en.wikipedia.org/wiki/Student%27s_t-test#cite_note-24“>[24]</a></sup> F</p><p>For non-normal data, the distribution of the sample variance may deviate substantially from a <i>χ</i>2 distribution.</p><p>However, if the sample size is large, <a href=„https://en.wikipedia.org/wiki/Slutsky%27s_theorem“ title=„Slutsky's theorem“>Slutsky's theorem</a> implies that the distribution of the sample variance has little effect on the distribution of the test statistic. That is, as sample size <img src=„https://wikimedia.org/api/rest_v1/media/math/render/svg/a601995d55609f2d9f5e233e36fbe9ea26011b3b“ class=„mwe-math-fallback-image-inline mw-invert skin-invert“ aria-hidden=„true“ alt=„{\displaystyle n}“ referrerpolicy=„no-referrer“ /> increases:</p><dl><dd><img src=„https://wikimedia.org/api/rest_v1/media/math/render/svg/9978c8ed5acc3638d9c993fb847dacee53e681ce“ class=„mwe-math-fallback-image-inline mw-invert skin-invert“ aria-hidden=„true“ alt=„{\displaystyle {\sqrt {n}}({\bar {X}}-\mu )\xrightarrow {d} N(0,\sigma ^{2})}“ referrerpolicy=„no-referrer“ /> as per the <a href=„https://en.wikipedia.org/wiki/Central_limit_theorem“ title=„Central limit theorem“>Central limit theorem</a>,</dd><dd><img src=„https://wikimedia.org/api/rest_v1/media/math/render/svg/064d4244a5d962be36bcfc3aacdb4a6e6472ab67“ class=„mwe-math-fallback-image-inline mw-invert skin-invert“ aria-hidden=„true“ alt=„{\displaystyle s^{2}\xrightarrow {p} \sigma ^{2}}“ referrerpolicy=„no-referrer“ /> as per the <a href=„https://en.wikipedia.org/wiki/Law_of_large_numbers“ title=„Law of large numbers“>law of large numbers</a>,</dd><dd><img src=„https://wikimedia.org/api/rest_v1/media/math/render/svg/e91506d1e2b7a454c4fdde91c293b4db6592cbaa“ class=„mwe-math-fallback-image-inline mw-invert skin-invert“ aria-hidden=„true“ alt=„{\displaystyle \therefore {\frac sqrt_n({\bar {X}}-\mu )}{s}}\xrightarrow {d} N(0,1)}“ referrerpolicy=„no-referrer“ />.</dd></dl><h2>Calculations[<a href=„https://en.wikipedia.org/w/index.php?title=Student%27s_t-test&action=edit&section=8“ title=„Edit section: Calculations“>edit</a>]</h2><p>Explicit expressions that can be used to carry out various <i>t</i>-tests are given below. In each case, the formula for a test statistic that either exactly follows or closely approximates a <i>t</i>-distribution under the null hypothesis is given. Also, the appropriate <a href=„https://en.wikipedia.org/wiki/Degrees_of_freedom_(statistics)“ title=„Degrees of freedom (statistics)“>degrees of freedom</a> are given in each case. Each of these statistics can be used to carry out either a <a href=„https://en.wikipedia.org/wiki/One-tailed_test“ class=„mw-redirect“ title=„One-tailed test“>one-tailed or two-tailed test</a>.</p><p>Once the <i>t</i> value and degrees of freedom are determined, a <a href=„https://en.wikipedia.org/wiki/P-value“ title=„P-value“><i>p</i>-value</a> can be found using a <a href=„https://en.wikipedia.org/wiki/Student%27s_t-distribution#Table_of_selected_values“ title=„Student's t-distribution“>table of values from Student's <i>t</i>-distribution</a>. If the calculated <i>p</i>-value is below the threshold chosen for <a href=„https://en.wikipedia.org/wiki/Statistical_significance“ title=„Statistical significance“>statistical significance</a> (usually the 0.10, the 0.05, or 0.01 level), then the null hypothesis is rejected in favor of the alternative hypothesis.</p><h3>Slope of a regression line[<a href=„https://en.wikipedia.org/w/index.php?title=Student%27s_t-test&action=edit&section=9“ title=„Edit section: Slope of a regression line“>edit</a>]</h3><p>Suppose one is fitting the model</p><dl><dd><img src=„https://wikimedia.org/api/rest_v1/media/math/render/svg/1c8a0086af5e212a11cca5ab8d531333d79b054d“ class=„mwe-math-fallback-image-inline mw-invert skin-invert“ aria-hidden=„true“ alt=„{\displaystyle Y=\alpha +\beta x+\varepsilon ,}“ referrerpolicy=„no-referrer“ /></dd></dl><p>where <i>x</i> is known, <i>α</i> and <i>β</i> are unknown, <i>ε</i> is a normally distributed random variable with mean 0 and unknown variance <i>σ</i>2, and <i>Y</i> is the outcome of interest. We want to test the null hypothesis that the slope <i>β</i> is equal to some specified value <i>β</i>0 (often taken to be 0, in which case the null hypothesis is that <i>x</i> and <i>y</i> are uncorrelated).</p><p>Let</p><dl><dd><img src=„https://wikimedia.org/api/rest_v1/media/math/render/svg/c1ca59fe879dd39e81a84f0ffd453a14e27bff3e“ class=„mwe-math-fallback-image-inline mw-invert skin-invert“ aria-hidden=„true“ alt=„{\displaystyle {\begin{aligned}{\hat {\alpha }},{\hat {\beta }}&={\text{least-squares estimators}},\\SE_{\hat {\alpha }},SE_{\hat {\beta }}&={\text{the standard errors of least-squares estimators}}.\end{aligned}}}“ referrerpolicy=„no-referrer“ /></dd></dl><p>Then</p><dl><dd><img src=„https://wikimedia.org/api/rest_v1/media/math/render/svg/84a8f00f09255d011fe502a0242189cd621399bd“ class=„mwe-math-fallback-image-inline mw-invert skin-invert“ aria-hidden=„true“ alt=„{\displaystyle t_{\text{score}}={\frac hat_beta-\beta _{0}}{SE_{\hat {\beta }}}}\sim {\mathcal {T}}_{n-2}}“ referrerpolicy=„no-referrer“ /></dd></dl><p>has a <i>t</i>-distribution with <i>n</i> − 2 degrees of freedom if the null hypothesis is true. The <a href=„https://en.wikipedia.org/wiki/Simple_linear_regression#Normality_assumption“ title=„Simple linear regression“>standard error of the slope coefficient</a>:</p><dl><dd><img src=„https://wikimedia.org/api/rest_v1/media/math/render/svg/a1081873b3ddcc69337c980bdc24732781ea2f85“ class=„mwe-math-fallback-image-inline mw-invert skin-invert“ aria-hidden=„true“ alt=„{\displaystyle SE_{\hat {\beta }}={\frac {\sqrt {\displaystyle {\frac {1}{n-2}}\sum _{i=1}^{n}(y_{i}-{\hat {y}}_{i})^{2}}}{\sqrt {\displaystyle \sum _{i=1}^{n}(x_{i}-{\bar {x}})^{2}}}}}“ referrerpolicy=„no-referrer“ /></dd></dl><p>can be written in terms of the residuals. Let</p><dl><dd><img src=„https://wikimedia.org/api/rest_v1/media/math/render/svg/1575fa23f185305b9707f6919b0d5359d8158a87“ class=„mwe-math-fallback-image-inline mw-invert skin-invert“ aria-hidden=„true“ alt=„{\displaystyle {\begin{aligned}{\hat {\varepsilon }}_{i}&=y_{i}-{\hat {y}}_{i}=y_{i}-({\hat {\alpha }}+{\hat {\beta }}x_{i})={\text{residuals}}={\text{estimated errors}},\\{\text{SSR}}&=\sum _{i=1}^{n}hat_varepsilon_{i}}^{2}={\text{sum of squares of residuals}}.\end{aligned}}}“ referrerpolicy=„no-referrer“ /></dd></dl><p>Then <i>t</i>score is given by</p><dl><dd><img src=„https://wikimedia.org/api/rest_v1/media/math/render/svg/5cb5f3a4e467a67d1dfc346ca722edbbb2a41145“ class=„mwe-math-fallback-image-inline mw-invert skin-invert“ aria-hidden=„true“ alt=„{\displaystyle t_{\text{score}}={\frac {({\hat {\beta }}-\beta _{0}){\sqrt {n-2}}}{\sqrt {\frac {SSR}{\sum _{i=1}^{n}(x_{i}-{\bar {x}})^{2}}}}}.}“ referrerpolicy=„no-referrer“ /></dd></dl><p>Another way to determine the <i>t</i>score is</p><dl><dd><img src=„https://wikimedia.org/api/rest_v1/media/math/render/svg/0b352cb2142064ce27ba30161b1faeb355021676“ class=„mwe-math-fallback-image-inline mw-invert skin-invert“ aria-hidden=„true“ alt=„{\displaystyle t_{\text{score}}={\frac {r{\sqrt {n-2}}}{\sqrt {1-r^{2}}}},}“ referrerpolicy=„no-referrer“ /></dd></dl><p>where <i>r</i> is the <a href=„https://en.wikipedia.org/wiki/Pearson_correlation_coefficient“ title=„Pearson correlation coefficient“>Pearson correlation coefficient</a>.</p><p>The <i>t</i>score, intercept can be determined from the <i>t</i>score, slope:</p><dl><dd><img src=„https://wikimedia.org/api/rest_v1/media/math/render/svg/1641c084c6122f4dab5ab3ec4e9b8cb6adb8a950“ class=„mwe-math-fallback-image-inline mw-invert skin-invert“ aria-hidden=„true“ alt=„{\displaystyle t_{\text{score,intercept}}={\frac {\alpha }{\beta }}{\frac {t_{\text{score,slope}}}{\sqrt {s_{\text{x}}^{2}+{\bar {x}}^{2}}}},}“ referrerpolicy=„no-referrer“ /></dd></dl><p>where <i>s</i>x2 is the sample variance.</p><h3>Independent two-sample <i>t</i>-test[<a href=„https://en.wikipedia.org/w/index.php?title=Student%27s_t-test&action=edit&section=10“ title=„Edit section: Independent two-sample t-test“>edit</a>]</h3><h4>Equal sample sizes and variance[<a href=„https://en.wikipedia.org/w/index.php?title=Student%27s_t-test&action=edit&section=11“ title=„Edit section: Equal sample sizes and variance“>edit</a>]</h4><p>Given two groups (1, 2), this test is only applicable when:</p><ul><li>the two sample sizes are equal,</li><li>it can be assumed that the two distributions have the same variance.</li></ul><p>Violations of these assumptions are discussed below.</p><p>The <i>t</i> statistic to test whether the means are different can be calculated as follows:</p><dl><dd><img src=„https://wikimedia.org/api/rest_v1/media/math/render/svg/09aab90a09d5dba053cb4e398f9999738c8ca5e3“ class=„mwe-math-fallback-image-inline mw-invert skin-invert“ aria-hidden=„true“ alt=„{\displaystyle t={\frac bar_x_{1}-{\bar {X}}_{2}}{s_{p}{\sqrt {\frac {2}{n}}}}},}“ referrerpolicy=„no-referrer“ /></dd></dl><p>where</p><dl><dd><img src=„https://wikimedia.org/api/rest_v1/media/math/render/svg/2adbe1794944e2924c113eacd348126a39746e59“ class=„mwe-math-fallback-image-inline mw-invert skin-invert“ aria-hidden=„true“ alt=„{\displaystyle s_{p}={\sqrt {\frac {s_{X_{1}}^{2}+s_{X_{2}}^{2}}{2}}}.}“ referrerpolicy=„no-referrer“ /></dd></dl><p>Here <i>sp</i> is the <a href=„https://en.wikipedia.org/wiki/Pooled_standard_deviation“ class=„mw-redirect“ title=„Pooled standard deviation“>pooled standard deviation</a> for <i>n</i> = <i>n</i>1 = <i>n</i>2, and <i>s</i> 2<br /><i>X</i><sub>1</sub> and <i>s</i> 2<br /><i>X</i><sub>2</sub> are the <a href=„https://en.wikipedia.org/wiki/Unbiased_estimator“ class=„mw-redirect“ title=„Unbiased estimator“>unbiased estimators</a> of the population variance. The denominator of <i>t</i> is the <a href=„https://en.wikipedia.org/wiki/Standard_error_(statistics)“ class=„mw-redirect“ title=„Standard error (statistics)“>standard error</a> of the difference between two means.</p><p>For significance testing, the <a href=„https://en.wikipedia.org/wiki/Degrees_of_freedom_(statistics)“ title=„Degrees of freedom (statistics)“>degrees of freedom</a> for this test is 2<i>n</i> − 2, where <i>n</i> is sample size.</p><h4>Equal or unequal sample sizes, similar variances (<link rel=„mw-deduplicated-inline-style“ href=„denied:mw-data:TemplateStyles:r1214402035“ />1/2 < <link rel=„mw-deduplicated-inline-style“ href=„denied:mw-data:TemplateStyles:r1214402035“ /><i>s</i><i>X</i><sub>1</sub>/<i>s</i><i>X</i><sub>2</sub> < 2)[<a href=„https://en.wikipedia.org/w/index.php?title=Student%27s_t-test&action=edit&section=12“ title=„Edit section: Equal or unequal sample sizes, similar variances (1/2 < sX1/sX2 < 2)“>edit</a>]</h4><p>This test is used only when it can be assumed that the two distributions have the same variance (when this assumption is violated, see below). The previous formulae are a special case of the formulae below, one recovers them when both samples are equal in size: <i>n</i> = <i>n</i>1 = <i>n</i>2.</p><p>The <i>t</i> statistic to test whether the means are different can be calculated as follows:</p><dl><dd><img src=„https://wikimedia.org/api/rest_v1/media/math/render/svg/20e3320e91f15044b696dc462c8451343f72b565“ class=„mwe-math-fallback-image-inline mw-invert skin-invert“ aria-hidden=„true“ alt=„{\displaystyle t={\frac bar_x_{1}-{\bar {X}}_{2}}{s_{p}\cdot {\sqrt frac_1_n_1}+{\frac {1}{n_{2}}}}}}},}“ referrerpolicy=„no-referrer“ /></dd></dl><p>where</p><dl><dd><img src=„https://wikimedia.org/api/rest_v1/media/math/render/svg/aef4eb4e491ef330a3ebd6e76bda2a262a52acfe“ class=„mwe-math-fallback-image-inline mw-invert skin-invert“ aria-hidden=„true“ alt=„{\displaystyle s_{p}={\sqrt {\frac {(n_{1}-1)s_{X_{1}}^{2}+(n_{2}-1)s_{X_{2}}^{2}}{n_{1}+n_{2}-2}}}}“ referrerpolicy=„no-referrer“ /></dd></dl><p>is the <a href=„https://en.wikipedia.org/wiki/Pooled_standard_deviation“ class=„mw-redirect“ title=„Pooled standard deviation“>pooled standard deviation</a> of the two samples: it is defined in this way so that its square is an <a href=„https://en.wikipedia.org/wiki/Unbiased_estimator“ class=„mw-redirect“ title=„Unbiased estimator“>unbiased estimator</a> of the common variance, whether or not the population means are the same. In these formulae, <i>ni</i> − 1 is the number of degrees of freedom for each group, and the total sample size minus two (that is, <i>n</i>1 + <i>n</i>2 − 2) is the total number of degrees of freedom, which is used in significance testing.</p><h4>Equal or unequal sample sizes, unequal variances (<i>s</i><i>X</i><sub>1</sub> > 2<i>s</i><i>X</i><sub>2</sub> or <i>s</i><i>X</i><sub>2</sub> > 2<i>s</i><i>X</i><sub>1</sub>)[<a href=„https://en.wikipedia.org/w/index.php?title=Student%27s_t-test&action=edit&section=13“ title=„Edit section: Equal or unequal sample sizes, unequal variances (sX1 > 2sX2 or sX2 > 2sX1)“>edit</a>]</h4><link rel=„mw-deduplicated-inline-style“ href=„denied:mw-data:TemplateStyles:r1033289096“ /><div role=„note“ class=„hatnote navigation-not-searchable“>Main article: <a href=„https://en.wikipedia.org/wiki/Welch%27s_t_test“ class=„mw-redirect“ title=„Welch's t test“>Welch's <i>t</i>-test</a></div><p>This test, also known as Welch's <i>t</i>-test, is used only when the two population variances are not assumed to be equal (the two sample sizes may or may not be equal) and hence must be estimated separately. The <i>t</i> statistic to test whether the population means are different is calculated as</p><dl><dd><img src=„https://wikimedia.org/api/rest_v1/media/math/render/svg/742c59818520bd420b11d0e844c46a22316a055f“ class=„mwe-math-fallback-image-inline mw-invert skin-invert“ aria-hidden=„true“ alt=„{\displaystyle t={\frac bar_x_{1}-{\bar {X}}_{2}}{s_{\bar {\Delta }}}},}“ referrerpolicy=„no-referrer“ /></dd></dl><p>where</p><dl><dd><img src=„https://wikimedia.org/api/rest_v1/media/math/render/svg/5024dd38e905d60353a324af2a05058fdd4ac3e7“ class=„mwe-math-fallback-image-inline mw-invert skin-invert“ aria-hidden=„true“ alt=„{\displaystyle s_{\bar {\Delta }}={\sqrt frac_s_1_2{n_{1}}}+{\frac {s_{2}^{2}}{n_{2}}}}}.}“ referrerpolicy=„no-referrer“ /></dd></dl><p>Here <i>si</i>2 is the <a href=„https://en.wikipedia.org/wiki/Unbiased_estimator“ class=„mw-redirect“ title=„Unbiased estimator“>unbiased estimator</a> of the <a href=„https://en.wikipedia.org/wiki/Variance“ title=„Variance“>variance</a> of each of the two samples with <i>ni</i> = number of participants in group <i>i</i> (<i>i</i> = 1 or 2). In this case <img src=„https://wikimedia.org/api/rest_v1/media/math/render/svg/14261fb3a8ce72b3cb026b279ecab8452714fc85“ class=„mwe-math-fallback-image-inline mw-invert skin-invert“ aria-hidden=„true“ alt=„{\displaystyle (s_{\bar {\Delta }})^{2}}“ referrerpolicy=„no-referrer“ />is not a pooled variance. For use in significance testing, the distribution of the test statistic is approximated as an ordinary Student's <i>t</i>-distribution with the degrees of freedom calculated using</p><dl><dd><img src=„https://wikimedia.org/api/rest_v1/media/math/render/svg/25159fe546cf459632f4743d874de9d0960cdc16“ class=„mwe-math-fallback-image-inline mw-invert skin-invert“ aria-hidden=„true“ alt=„{\displaystyle {\text{d.f.}}={\frac {\left({\frac {s_{1}^{2}}{n_{1}}}+{\frac {s_{2}^{2}}{n_{2}}}\right)^{2}}frac_s_1_2_n_1_2{n_{1}-1}}+{\frac {(s_{2}^{2}/n_{2})^{2}}{n_{2}-1}}}}.}“ referrerpolicy=„no-referrer“ /></dd></dl><p>This is known as the <a href=„https://en.wikipedia.org/wiki/Welch%E2%80%93Satterthwaite_equation“ title=„Welch–Satterthwaite equation“>Welch–Satterthwaite equation</a>. The true distribution of the test statistic actually depends (slightly) on the two unknown population variances (see <a href=„https://en.wikipedia.org/wiki/Behrens%E2%80%93Fisher_problem“ title=„Behrens–Fisher problem“>Behrens–Fisher problem</a>).</p><h3>Exact method for unequal variances and sample sizes[<a href=„https://en.wikipedia.org/w/index.php?title=Student%27s_t-test&action=edit&section=14“ title=„Edit section: Exact method for unequal variances and sample sizes“>edit</a>]</h3><p>The test<sup id=„cite_ref-25“ class=„reference“><a href=„https://en.wikipedia.org/wiki/Student%27s_t-test#cite_note-25“>[25]</a></sup> deals with the famous <a href=„https://en.wikipedia.org/wiki/Behrens%E2%80%93Fisher_problem“ title=„Behrens–Fisher problem“>Behrens–Fisher problem</a>, i.e., comparing the difference between the means of two normally distributed populations when the variances of the two populations are not assumed to be equal, based on two independent samples.</p><p>The test is developed as an <a href=„https://en.wikipedia.org/wiki/Exact_test“ title=„Exact test“>exact test</a> that allows for <b>unequal sample sizes</b> and <b>unequal variances</b> of two populations. The exact property still holds even with small <b>extremely small and unbalanced sample sizes</b> (e.g. <img src=„https://wikimedia.org/api/rest_v1/media/math/render/svg/1c17d0c5c824726f2b3ffd5ea3200fe1636982eb“ class=„mwe-math-fallback-image-inline mw-invert skin-invert“ aria-hidden=„true“ alt=„{\displaystyle n_{1}=5,n_{2}=50}“ referrerpolicy=„no-referrer“ />).</p><p>The statistic to test whether the means are different can be calculated as follows:</p><p>Let <img src=„https://wikimedia.org/api/rest_v1/media/math/render/svg/a0f37f25b326e4b6229a7f0be5283ace07d1a97f“ class=„mwe-math-fallback-image-inline mw-invert skin-invert“ aria-hidden=„true“ alt=„{\displaystyle X=[X_{1},X_{2},\ldots ,X_{m}]^{T}}“ referrerpolicy=„no-referrer“ /> and <img src=„https://wikimedia.org/api/rest_v1/media/math/render/svg/a81b49d1f74f1a3c22759407966c63524eac1d2e“ class=„mwe-math-fallback-image-inline mw-invert skin-invert“ aria-hidden=„true“ alt=„{\displaystyle Y=[Y_{1},Y_{2},\ldots ,Y_{n}]^{T}}“ referrerpolicy=„no-referrer“ /> be the i.i.d. sample vectors (<img src=„https://wikimedia.org/api/rest_v1/media/math/render/svg/6b02f25e62da7fe3162ac80446437cdc1c0fd341“ class=„mwe-math-fallback-image-inline mw-invert skin-invert“ aria-hidden=„true“ alt=„{\displaystyle m\geq n}“ referrerpolicy=„no-referrer“ />) from <img src=„https://wikimedia.org/api/rest_v1/media/math/render/svg/d9dbf59da00f341cb16baedd49933ec34ec19427“ class=„mwe-math-fallback-image-inline mw-invert skin-invert“ aria-hidden=„true“ alt=„{\displaystyle N(\mu _{1},\sigma _{1}^{2})}“ referrerpolicy=„no-referrer“ /> and <img src=„https://wikimedia.org/api/rest_v1/media/math/render/svg/e2007bbb1e654885481e455e5f340453cad4b7e7“ class=„mwe-math-fallback-image-inline mw-invert skin-invert“ aria-hidden=„true“ alt=„{\displaystyle N(\mu _{2},\sigma _{2}^{2})}“ referrerpolicy=„no-referrer“ /> separately.</p><p>Let <img src=„https://wikimedia.org/api/rest_v1/media/math/render/svg/73863c93aef0f1157dbf780aa79979f32c78e427“ class=„mwe-math-fallback-image-inline mw-invert skin-invert“ aria-hidden=„true“ alt=„{\displaystyle (P^{T})_{n\times n}}“ referrerpolicy=„no-referrer“ /> be an <img src=„https://wikimedia.org/api/rest_v1/media/math/render/svg/59d2b4cb72e304526cf5b5887147729ea259da78“ class=„mwe-math-fallback-image-inline mw-invert skin-invert“ aria-hidden=„true“ alt=„{\displaystyle n\times n}“ referrerpolicy=„no-referrer“ /> orthogonal matrix whose elements of the first row are all <img src=„https://wikimedia.org/api/rest_v1/media/math/render/svg/e07670d2dac5bafa33cf25175a1374206563e22e“ class=„mwe-math-fallback-image-inline mw-invert skin-invert“ aria-hidden=„true“ alt=„{\displaystyle 1/{\sqrt {n}}}“ referrerpolicy=„no-referrer“ />, similarly, let <img src=„https://wikimedia.org/api/rest_v1/media/math/render/svg/b2f952582468810da1e883e32dbb6ee4a0d9b09e“ class=„mwe-math-fallback-image-inline mw-invert skin-invert“ aria-hidden=„true“ alt=„{\displaystyle (Q^{T})_{n\times m}}“ referrerpolicy=„no-referrer“ /> be the first n rows of an <img src=„https://wikimedia.org/api/rest_v1/media/math/render/svg/367523981d714dcd9214703d654bfdedbe58d44a“ class=„mwe-math-fallback-image-inline mw-invert skin-invert“ aria-hidden=„true“ alt=„{\displaystyle m\times m}“ referrerpolicy=„no-referrer“ /> orthogonal matrix (whose elements of the first row are all <img src=„https://wikimedia.org/api/rest_v1/media/math/render/svg/b9d0ccf6bf7c8456f1b832ad59ec1d717380cd68“ class=„mwe-math-fallback-image-inline mw-invert skin-invert“ aria-hidden=„true“ alt=„{\displaystyle 1/{\sqrt {m}}}“ referrerpolicy=„no-referrer“ />).</p><p>Then <img src=„https://wikimedia.org/api/rest_v1/media/math/render/svg/53fdf3e89b640dbb4ea79722739b9947771cdf06“ class=„mwe-math-fallback-image-inline mw-invert skin-invert“ aria-hidden=„true“ alt=„{\displaystyle Z:=(Q^{T})_{n\times m}X/{\sqrt {m}}-(P^{T})_{n\times n}Y/{\sqrt {n}}}“ referrerpolicy=„no-referrer“ /> is an n-dimensional normal random vector.</p><dl><dd><img src=„https://wikimedia.org/api/rest_v1/media/math/render/svg/7de7afc74ef6ea70f6fea2347a99c1753fc8d47f“ class=„mwe-math-fallback-image-inline mw-invert skin-invert“ aria-hidden=„true“ alt=„{\displaystyle Z\sim N1)</pre></div><p>Perform the t-test. Notice that the assumption of equal variance,
var.equal=T
, is required to make the analysis exactly equivalent to simple linear regression.</p><div class=„mw-highlight mw-highlight-lang-r mw-content-ltr“ dir=„ltr“><pre>>with(word.recall.data,t.test(word.recall~drug.dose,var.equal=T))</pre></div><p>Running the R code gives the following results.</p><ul><li>The mean word.recall in the 0 drug.dose group is 2.</li><li>The mean word.recall in the 1 drug.dose group is 6.</li><li>The difference between treatment groups in the mean word.recall is 6 – 2 = 4.</li><li>The difference in word.recall between drug doses is significant (p=0.00805).</li></ul><p>Perform a linear regression of the same data. Calculations may be performed using the R function
lm()
for a linear model. </p><div class=„mw-highlight mw-highlight-lang-r mw-content-ltr“ dir=„ltr“><pre>>word.recall.data.lm=lm(word.recall~drug.dose,data=word.recall.data)>summary(word.recall.data.lm)</pre></div><p>The linear regression provides a table of coefficients and p-values.</p><table class=„wikitable“><tbody><tr><th>Coefficient</th><th>Estimate</th><th>Std. Error</th><th>t value</th><th>P-value</th></tr><tr><th>Intercept</th><th>2</th><th>0.5774</th><th>3.464</th><td>0.02572</td></tr><tr><th>drug.dose</th><th>4</th><th>0.8165</th><th>4.899</th><td>0.000805</td></tr></tbody></table><p>The table of coefficients gives the following results.</p><ul><li>The estimate value of 2 for the intercept is the mean value of the word recall when the drug dose is 0.</li><li>The estimate value of 4 for the drug dose indicates that for a 1-unit change in drug dose (from 0 to 1) there is a 4-unit change in mean word recall (from 2 to 6). This is the slope of the line joining the two group means.</li><li>The p-value that the slope of 4 is different from 0 is p = 0.00805.</li></ul><p>The coefficients for the linear regression specify the slope and intercept of the line that joins the two group means, as illustrated in the graph. The intercept is 2 and the slope is 4.</p><p><a href=„https://en.wikipedia.org/wiki/File:Regression_lines_with_slopes_4_and_0.jpg“ class=„mw-file-description“ title=„Regression lines“><img alt=„Regression lines“ src=„https://upload.wikimedia.org/wikipedia/commons/b/bf/Regression_lines_with_slopes_4_and_0.jpg“ width=„400“ height=„263“ class=„mw-file-element“ data-file-width=„400“ data-file-height=„263“ referrerpolicy=„no-referrer“ /></a></p><p>Compare the result from the linear regression to the result from the t-test.</p><ul><li>From the t-test, the difference between the group means is 6-2=4.</li><li>From the regression, the slope is also 4 indicating that a 1-unit change in drug dose (from 0 to 1) gives a 4-unit change in mean word recall (from 2 to 6).</li><li>The t-test p-value for the difference in means, and the regression p-value for the slope, are both 0.00805. The methods give identical results.</li></ul><p>This example shows that, for the special case of a simple linear regression where there is a single x-variable that has values 0 and 1, the t-test gives the same results as the linear regression. The relationship can also be shown algebraically.</p><p>Recognizing this relationship between the t-test and linear regression facilitates the use of multiple linear regression and multi-way <a href=„https://en.wikipedia.org/wiki/Analysis_of_variance“ title=„Analysis of variance“>analysis of variance</a>. These alternatives to t-tests allow for the inclusion of additional <a href=„https://en.wikipedia.org/wiki/Dependent_and_independent_variables“ title=„Dependent and independent variables“>explanatory variables</a> that are associated with the response. Including such additional explanatory variables using regression or anova reduces the otherwise unexplained <a href=„https://en.wikipedia.org/wiki/Variance“ title=„Variance“>variance</a>, and commonly yields greater <a href=„https://en.wikipedia.org/wiki/Power_of_a_test“ title=„Power of a test“>power</a> to detect differences than do two-sample t-tests.</p><h2>Software implementations[<a href=„https://en.wikipedia.org/w/index.php?title=Student%27s_t-test&action=edit&section=24“ title=„Edit section: Software implementations“>edit</a>]</h2><p>Many <a href=„https://en.wikipedia.org/wiki/Spreadsheet“ title=„Spreadsheet“>spreadsheet</a> programs and statistics packages, such as <a href=„https://en.wikipedia.org/wiki/QtiPlot“ title=„QtiPlot“>QtiPlot</a>, <a href=„https://en.wikipedia.org/wiki/LibreOffice_Calc“ title=„LibreOffice Calc“>LibreOffice Calc</a>, <a href=„https://en.wikipedia.org/wiki/Microsoft_Excel“ title=„Microsoft Excel“>Microsoft Excel</a>, <a href=„https://en.wikipedia.org/wiki/SAS_(software)“ title=„SAS (software)“>SAS</a>, <a href=„https://en.wikipedia.org/wiki/SPSS“ title=„SPSS“>SPSS</a>, <a href=„https://en.wikipedia.org/wiki/Stata“ title=„Stata“>Stata</a>, <a href=„https://en.wikipedia.org/wiki/DAP_(software)“ title=„DAP (software)“>DAP</a>, <a href=„https://en.wikipedia.org/wiki/Gretl“ title=„Gretl“>gretl</a>, <a href=„https://en.wikipedia.org/wiki/R_(programming_language)“ title=„R (programming language)“>R</a>, <a href=„https://en.wikipedia.org/wiki/Python_(programming_language)“ title=„Python (programming language)“>Python</a>, <a href=„https://en.wikipedia.org/wiki/PSPP“ title=„PSPP“>PSPP</a>, <a href=„https://en.wikipedia.org/wiki/Wolfram_Mathematica“ title=„Wolfram Mathematica“>Wolfram Mathematica</a>, <a href=„https://en.wikipedia.org/wiki/MATLAB“ title=„MATLAB“>MATLAB</a> and <a href=„https://en.wikipedia.org/wiki/Minitab“ title=„Minitab“>Minitab</a>, include implementations of Student's <i>t</i>-test.</p><table class=„wikitable sortable“><tbody><tr><th>Language/Program</th><th>Function</th><th>Notes</th></tr><tr><td><a href=„https://en.wikipedia.org/wiki/Microsoft_Excel“ title=„Microsoft Excel“>Microsoft Excel</a> pre 2010</td><td>
TTEST(<i>array1</i>, <i>array2</i>, <i>tails</i>, <i>type</i>)
</td><td>See <a rel=„nofollow“ class=„external autonumber“ href=„https://support.office.com/en-US/article/TTEST-function-1696FFC1-4811-40FD-9D13-A0EAAD83C7AE“>[1]</a></td></tr><tr><td><a href=„https://en.wikipedia.org/wiki/Microsoft_Excel“ title=„Microsoft Excel“>Microsoft Excel</a> 2010 and later</td><td>
T.TEST(<i>array1</i>, <i>array2</i>, <i>tails</i>, <i>type</i>)
</td><td>See <a rel=„nofollow“ class=„external autonumber“ href=„https://support.office.com/en-US/article/TTEST-function-d4e08ec3-c545-485f-962e-276f7cbed055“>[2]</a></td></tr><tr><td><a href=„https://en.wikipedia.org/wiki/Apple_Numbers“ class=„mw-redirect“ title=„Apple Numbers“>Apple Numbers</a></td><td>
TTEST(sample-1-values, sample-2-values, tails, test-type)
</td><td>See <a rel=„nofollow“ class=„external autonumber“ href=„https://www.apple.com/au/mac/numbers/compatibility/functions.html“>[3]</a></td></tr><tr><td><a href=„https://en.wikipedia.org/wiki/LibreOffice_Calc“ title=„LibreOffice Calc“>LibreOffice Calc</a></td><td>
TTEST(<i>Data1; Data2; Mode; Type</i>)
</td><td>See <a rel=„nofollow“ class=„external autonumber“ href=„https://help.libreoffice.org/Calc/Statistical_Functions_Part_Five#TTEST“>[4]</a></td></tr><tr><td><a href=„https://en.wikipedia.org/wiki/Google_Sheets“ title=„Google Sheets“>Google Sheets</a></td><td>
TTEST(range1, range2, tails, type)
</td><td>See <a rel=„nofollow“ class=„external autonumber“ href=„https://support.google.com/docs/answer/6055837“>[5]</a></td></tr><tr><td><a href=„https://en.wikipedia.org/wiki/Python_(programming_language)“ title=„Python (programming language)“>Python</a></td><td>
scipy.stats.ttest_ind(<i>a</i>, <i>b</i>, <i>equal_var=True</i>)
</td><td>See <a rel=„nofollow“ class=„external autonumber“ href=„http://docs.scipy.org/doc/scipy/reference/generated/scipy.stats.ttest_ind.html“>[6]</a></td></tr><tr><td><a href=„https://en.wikipedia.org/wiki/MATLAB“ title=„MATLAB“>MATLAB</a></td><td>
ttest(data1, data2)
</td><td>See <a rel=„nofollow“ class=„external autonumber“ href=„http://www.mathworks.com/help/stats/ttest.html“>[7]</a></td></tr><tr><td><a href=„https://en.wikipedia.org/wiki/Mathematica“ class=„mw-redirect“ title=„Mathematica“>Mathematica</a></td><td>
TTest[{data1,data2}]
</td><td>See <a rel=„nofollow“ class=„external autonumber“ href=„https://reference.wolfram.com/language/ref/TTest.html“>[8]</a></td></tr><tr><td><a href=„https://en.wikipedia.org/wiki/R_(programming_language)“ title=„R (programming language)“>R</a></td><td>
t.test(data1, data2, var.equal=TRUE)
</td><td>See <a rel=„nofollow“ class=„external autonumber“ href=„https://stat.ethz.ch/R-manual/R-devel/library/stats/html/t.test.html“>[9]</a></td></tr><tr><td><a href=„https://en.wikipedia.org/wiki/SAS_(software)“ title=„SAS (software)“>SAS</a></td><td>
PROC TTEST
</td><td>See <a rel=„nofollow“ class=„external autonumber“ href=„https://web.archive.org/web/20131029195637/http://www.sas.com/offices/europe/belux/pdf/academic/ttest.pdf“>[10]</a></td></tr><tr><td><a href=„https://en.wikipedia.org/wiki/Java_(programming_language)“ title=„Java (programming language)“>Java</a></td><td>
tTest(sample1, sample2)
</td><td>See <a rel=„nofollow“ class=„external autonumber“ href=„http://commons.apache.org/proper/commons-math/apidocs/org/apache/commons/math4/stat/inference/TTest.html“>[11]</a></td></tr><tr><td><a href=„https://en.wikipedia.org/wiki/Julia_(programming_language)“ title=„Julia (programming language)“>Julia</a></td><td>
EqualVarianceTTest(sample1, sample2)
</td><td>See <a rel=„nofollow“ class=„external autonumber“ href=„https://juliastats.org/HypothesisTests.jl/stable/parametric/#HypothesisTests.EqualVarianceTTest“>[12]</a></td></tr><tr><td><a href=„https://en.wikipedia.org/wiki/Stata“ title=„Stata“>Stata</a></td><td>
ttest data1 == data2
</td><td>See <a rel=„nofollow“ class=„external autonumber“ href=„https://www.stata.com/manuals/rttest.pdf“>[13]</a></td></tr></tbody></table><h2>See also[<a href=„https://en.wikipedia.org/w/index.php?title=Student%27s_t-test&action=edit&section=25“ title=„Edit section: See also“>edit</a>]</h2><style data-mw-deduplicate=„TemplateStyles:r1214689105“ scoped=„scoped“></style><ul><li><a href=„https://en.wikipedia.org/wiki/Conditional_change_model“ title=„Conditional change model“>Conditional change model</a></li><li><a href=„https://en.wikipedia.org/wiki/F-test“ title=„F-test“><i>F</i>-test</a> – Statistical hypothesis test, mostly using multiple restrictions</li><li><a href=„https://en.wikipedia.org/wiki/Noncentral_t-distribution#Use_in_power_analysis“ title=„Noncentral t-distribution“>Noncentral <i>t</i>-distribution in power analysis</a> – Probability distribution</li><li><a href=„https://en.wikipedia.org/wiki/Student%27s_t-statistic“ class=„mw-redirect“ title=„Student's t-statistic“>Student's <i>t</i>-statistic</a> – Ratio in statisticsPages displaying short descriptions of redirect targets</li><li><a href=„https://en.wikipedia.org/wiki/Z-test“ title=„Z-test“><i>Z</i>-test</a> – Statistical test</li><li><a href=„https://en.wikipedia.org/wiki/Mann%E2%80%93Whitney_U_test“ title=„Mann–Whitney U test“>Mann–Whitney <i>U</i> test</a> – Nonparametric test of the null hypothesis</li><li><a href=„https://en.wikipedia.org/wiki/%C5%A0id%C3%A1k_correction_for_t-test“ title=„Šidák correction for t-test“>Šidák correction for <i>t</i>-test</a> – Statistical method</li><li><a href=„https://en.wikipedia.org/wiki/Welch%27s_t-test“ title=„Welch's t-test“>Welch's <i>t</i>-test</a> – Statistical test of whether two populations have equal means</li><li><a href=„https://en.wikipedia.org/wiki/Analysis_of_variance“ title=„Analysis of variance“>Analysis of variance</a> – Collection of statistical models (ANOVA)</li></ul><h2>References[<a href=„https://en.wikipedia.org/w/index.php?title=Student%27s_t-test&action=edit&section=26“ title=„Edit section: References“>edit</a>]</h2><style data-mw-deduplicate=„TemplateStyles:r1217336898“ scoped=„scoped“></style><div class=„reflist“><div class=„mw-references-wrap mw-references-columns“><ol class=„references“><li id=„cite_note-1“><b><a href=„https://en.wikipedia.org/wiki/Student%27s_t-test#cite_ref-1“>^</a></b> <style data-mw-deduplicate=„TemplateStyles:r1215172403“ scoped=„scoped“></style><cite class=„citation book cs1“><a rel=„nofollow“ class=„external text“ href=„https://books.google.com/books?id=kiToDwAAQBAJ&pg=PA397“><i>The Microbiome in Health and Disease</i></a>. Academic Press. 2020-05-29. p. 397. <a href=„https://en.wikipedia.org/wiki/ISBN_(identifier)“ class=„mw-redirect“ title=„ISBN (identifier)“>ISBN</a> <a href=„https://en.wikipedia.org/wiki/Special:BookSources/978-0-12-820001-8“ title=„Special:BookSources/978-0-12-820001-8“><bdi>978-0-12-820001-8</bdi></a>.</cite></li><li id=„cite_note-2“><b><a href=„https://en.wikipedia.org/wiki/Student%27s_t-test#cite_ref-2“>^</a></b> <link rel=„mw-deduplicated-inline-style“ href=„denied:mw-data:TemplateStyles:r1215172403“ /><cite id=„CITEREFSzabó2003“ class=„citation book cs1 cs1-prop-foreign-lang-source“>Szabó, István (2003). „Systeme aus einer endlichen Anzahl starrer Körper“. <i>Einführung in die Technische Mechanik</i> (in German). Springer Berlin Heidelberg. pp. 196–199. <a href=„https://en.wikipedia.org/wiki/Doi_(identifier)“ class=„mw-redirect“ title=„Doi (identifier)“>doi</a>:<a rel=„nofollow“ class=„external text“ href=„https://doi.org/10.1007%2F978-3-642-61925-0_16“>10.1007/978-3-642-61925-0_16</a>. <a href=„https://en.wikipedia.org/wiki/ISBN_(identifier)“ class=„mw-redirect“ title=„ISBN (identifier)“>ISBN</a> <a href=„https://en.wikipedia.org/wiki/Special:BookSources/978-3-540-13293-6“ title=„Special:BookSources/978-3-540-13293-6“><bdi>978-3-540-13293-6</bdi></a>.</cite></li><li id=„cite_note-3“><b><a href=„https://en.wikipedia.org/wiki/Student%27s_t-test#cite_ref-3“>^</a></b> <link rel=„mw-deduplicated-inline-style“ href=„denied:mw-data:TemplateStyles:r1215172403“ /><cite id=„CITEREFSchlyvitch1937“ class=„citation journal cs1 cs1-prop-foreign-lang-source“>Schlyvitch, B. (October 1937). „Untersuchungen über den anastomotischen Kanal zwischen der Arteria coeliaca und mesenterica superior und damit in Zusammenhang stehende Fragen“. <i>Zeitschrift für Anatomie und Entwicklungsgeschichte</i> (in German). <b>107</b> (6): 709–737. <a href=„https://en.wikipedia.org/wiki/Doi_(identifier)“ class=„mw-redirect“ title=„Doi (identifier)“>doi</a>:<a rel=„nofollow“ class=„external text“ href=„https://doi.org/10.1007%2Fbf02118337“>10.1007/bf02118337</a>. <a href=„https://en.wikipedia.org/wiki/ISSN_(identifier)“ class=„mw-redirect“ title=„ISSN (identifier)“>ISSN</a> <a rel=„nofollow“ class=„external text“ href=„https://www.worldcat.org/issn/0340-2061“>0340-2061</a>. <a href=„https://en.wikipedia.org/wiki/S2CID_(identifier)“ class=„mw-redirect“ title=„S2CID (identifier)“>S2CID</a> <a rel=„nofollow“ class=„external text“ href=„https://api.semanticscholar.org/CorpusID:27311567“>27311567</a>.</cite></li><li id=„cite_note-4“><b><a href=„https://en.wikipedia.org/wiki/Student%27s_t-test#cite_ref-4“>^</a></b> <link rel=„mw-deduplicated-inline-style“ href=„denied:mw-data:TemplateStyles:r1215172403“ /><cite id=„CITEREFHelmert1876“ class=„citation journal cs1 cs1-prop-foreign-lang-source“>Helmert (1876). <a rel=„nofollow“ class=„external text“ href=„https://zenodo.org/record/1424695“>„Die Genauigkeit der Formel von Peters zur Berechnung des wahrscheinlichen Beobachtungsfehlers directer Beobachtungen gleicher Genauigkeit“</a>. <i>Astronomische Nachrichten</i> (in German). <b>88</b> (8–9): 113–131. <a href=„https://en.wikipedia.org/wiki/Bibcode_(identifier)“ class=„mw-redirect“ title=„Bibcode (identifier)“>Bibcode</a>:<a rel=„nofollow“ class=„external text“ href=„https://ui.adsabs.harvard.edu/abs/1876AN.....88..113H“>1876AN…..88..113H</a>. <a href=„https://en.wikipedia.org/wiki/Doi_(identifier)“ class=„mw-redirect“ title=„Doi (identifier)“>doi</a>:<a rel=„nofollow“ class=„external text“ href=„https://doi.org/10.1002%2Fasna.18760880802“>10.1002/asna.18760880802</a>.</cite></li><li id=„cite_note-5“><b><a href=„https://en.wikipedia.org/wiki/Student%27s_t-test#cite_ref-5“>^</a></b> <link rel=„mw-deduplicated-inline-style“ href=„denied:mw-data:TemplateStyles:r1215172403“ /><cite id=„CITEREFLüroth1876“ class=„citation journal cs1 cs1-prop-foreign-lang-source“>Lüroth, J. (1876). <a rel=„nofollow“ class=„external text“ href=„https://zenodo.org/record/1424693“>„Vergleichung von zwei Werthen des wahrscheinlichen Fehlers“</a>. <i>Astronomische Nachrichten</i> (in German). <b>87</b> (14): 209–220. <a href=„https://en.wikipedia.org/wiki/Bibcode_(identifier)“ class=„mw-redirect“ title=„Bibcode (identifier)“>Bibcode</a>:<a rel=„nofollow“ class=„external text“ href=„https://ui.adsabs.harvard.edu/abs/1876AN.....87..209L“>1876AN…..87..209L</a>. <a href=„https://en.wikipedia.org/wiki/Doi_(identifier)“ class=„mw-redirect“ title=„Doi (identifier)“>doi</a>:<a rel=„nofollow“ class=„external text“ href=„https://doi.org/10.1002%2Fasna.18760871402“>10.1002/asna.18760871402</a>.</cite></li><li id=„cite_note-6“><b><a href=„https://en.wikipedia.org/wiki/Student%27s_t-test#cite_ref-6“>^</a></b> <link rel=„mw-deduplicated-inline-style“ href=„denied:mw-data:TemplateStyles:r1215172403“ /><cite id=„CITEREFPfanzagl1996“ class=„citation journal cs1“>Pfanzagl, J. (1996). „Studies in the history of probability and statistics XLIV. A forerunner of the <i>t</i>-distribution“. <i>Biometrika</i>. <b>83</b> (4): 891–898. <a href=„https://en.wikipedia.org/wiki/Doi_(identifier)“ class=„mw-redirect“ title=„Doi (identifier)“>doi</a>:<a rel=„nofollow“ class=„external text“ href=„https://doi.org/10.1093%2Fbiomet%2F83.4.891“>10.1093/biomet/83.4.891</a>. <a href=„https://en.wikipedia.org/wiki/MR_(identifier)“ class=„mw-redirect“ title=„MR (identifier)“>MR</a> <a rel=„nofollow“ class=„external text“ href=„https://mathscinet.ams.org/mathscinet-getitem?mr=1766040“>1766040</a>.</cite></li><li id=„cite_note-7“><b><a href=„https://en.wikipedia.org/wiki/Student%27s_t-test#cite_ref-7“>^</a></b> <link rel=„mw-deduplicated-inline-style“ href=„denied:mw-data:TemplateStyles:r1215172403“ /><cite id=„CITEREFSheynin1995“ class=„citation journal cs1“>Sheynin, Oscar (1995). „Helmert's work in the theory of errors“. <i>Archive for History of Exact Sciences</i>. <b>49</b> (1): 73–104. <a href=„https://en.wikipedia.org/wiki/Doi_(identifier)“ class=„mw-redirect“ title=„Doi (identifier)“>doi</a>:<a rel=„nofollow“ class=„external text“ href=„https://doi.org/10.1007%2FBF00374700“>10.1007/BF00374700</a>. <a href=„https://en.wikipedia.org/wiki/ISSN_(identifier)“ class=„mw-redirect“ title=„ISSN (identifier)“>ISSN</a> <a rel=„nofollow“ class=„external text“ href=„https://www.worldcat.org/issn/0003-9519“>0003-9519</a>. <a href=„https://en.wikipedia.org/wiki/S2CID_(identifier)“ class=„mw-redirect“ title=„S2CID (identifier)“>S2CID</a> <a rel=„nofollow“ class=„external text“ href=„https://api.semanticscholar.org/CorpusID:121241599“>121241599</a>.</cite></li><li id=„cite_note-8“><b><a href=„https://en.wikipedia.org/wiki/Student%27s_t-test#cite_ref-8“>^</a></b> <link rel=„mw-deduplicated-inline-style“ href=„denied:mw-data:TemplateStyles:r1215172403“ /><cite id=„CITEREFPearson1895“ class=„citation journal cs1“>Pearson, Karl (1895). <a rel=„nofollow“ class=„external text“ href=„https://doi.org/10.1098%2Frsta.1895.0010“>„X. Contributions to the mathematical theory of evolution.—II. Skew variation in homogeneous material“</a>. <i>Philosophical Transactions of the Royal Society of London A</i>. <b>186</b>: 343–414. <a href=„https://en.wikipedia.org/wiki/Bibcode_(identifier)“ class=„mw-redirect“ title=„Bibcode (identifier)“>Bibcode</a>:<a rel=„nofollow“ class=„external text“ href=„https://ui.adsabs.harvard.edu/abs/1895RSPTA.186..343P“>1895RSPTA.186..343P</a>. <a href=„https://en.wikipedia.org/wiki/Doi_(identifier)“ class=„mw-redirect“ title=„Doi (identifier)“>doi</a>:<a rel=„nofollow“ class=„external text“ href=„https://doi.org/10.1098%2Frsta.1895.0010“>10.1098/rsta.1895.0010</a>.</cite></li><li id=„cite_note-The_Probable_Error_of_a_Mean-9“>^ <a href=„https://en.wikipedia.org/wiki/Student%27s_t-test#cite_ref-The_Probable_Error_of_a_Mean_9-0“><i><b>a</b></i></a> <a href=„https://en.wikipedia.org/wiki/Student%27s_t-test#cite_ref-The_Probable_Error_of_a_Mean_9-1“><i><b>b</b></i></a> <link rel=„mw-deduplicated-inline-style“ href=„denied:mw-data:TemplateStyles:r1215172403“ /><cite id=„CITEREFStudent1908“ class=„citation journal cs1“>Student (1908). <a rel=„nofollow“ class=„external text“ href=„http://seismo.berkeley.edu/~kirchner/eps_120/Odds_n_ends/Students_original_paper.pdf“>„The Probable Error of a Mean“</a> (PDF). <i><a href=„https://en.wikipedia.org/wiki/Biometrika“ title=„Biometrika“>Biometrika</a></i>. <b>6</b> (1): 1–25. <a href=„https://en.wikipedia.org/wiki/Doi_(identifier)“ class=„mw-redirect“ title=„Doi (identifier)“>doi</a>:<a rel=„nofollow“ class=„external text“ href=„https://doi.org/10.1093%2Fbiomet%2F6.1.1“>10.1093/biomet/6.1.1</a>. <a href=„https://en.wikipedia.org/wiki/Hdl_(identifier)“ class=„mw-redirect“ title=„Hdl (identifier)“>hdl</a>:<a rel=„nofollow“ class=„external text“ href=„https://hdl.handle.net/10338.dmlcz%2F143545“>10338.dmlcz/143545</a>. Retrieved 24 July 2016.</cite></li><li id=„cite_note-10“><b><a href=„https://en.wikipedia.org/wiki/Student%27s_t-test#cite_ref-10“>^</a></b> <link rel=„mw-deduplicated-inline-style“ href=„denied:mw-data:TemplateStyles:r1215172403“ /><cite class=„citation web cs1“><a rel=„nofollow“ class=„external text“ href=„https://www.tdistributiontable.com“>„T Table“</a>.</cite></li><li id=„cite_note-11“><b><a href=„https://en.wikipedia.org/wiki/Student%27s_t-test#cite_ref-11“>^</a></b> <link rel=„mw-deduplicated-inline-style“ href=„denied:mw-data:TemplateStyles:r1215172403“ /><cite id=„CITEREFWendl2016“ class=„citation journal cs1“>Wendl, Michael C. (2016). „Pseudonymous fame“. <i>Science</i>. <b>351</b> (6280): 1406. <a href=„https://en.wikipedia.org/wiki/Doi_(identifier)“ class=„mw-redirect“ title=„Doi (identifier)“>doi</a>:<a rel=„nofollow“ class=„external text“ href=„https://doi.org/10.1126%2Fscience.351.6280.1406“>10.1126/science.351.6280.1406</a>. <a href=„https://en.wikipedia.org/wiki/PMID_(identifier)“ class=„mw-redirect“ title=„PMID (identifier)“>PMID</a> <a rel=„nofollow“ class=„external text“ href=„https://pubmed.ncbi.nlm.nih.gov/27013722“>27013722</a>.</cite></li><li id=„cite_note-12“><b><a href=„https://en.wikipedia.org/wiki/Student%27s_t-test#cite_ref-12“>^</a></b> <link rel=„mw-deduplicated-inline-style“ href=„denied:mw-data:TemplateStyles:r1215172403“ /><cite id=„CITEREFWalpole,_Ronald_E.2006“ class=„citation book cs1“>Walpole, Ronald E. (2006). <i>Probability & statistics for engineers & scientists</i>. Myers, H. Raymond (7th ed.). New Delhi: Pearson. <a href=„https://en.wikipedia.org/wiki/ISBN_(identifier)“ class=„mw-redirect“ title=„ISBN (identifier)“>ISBN</a> <a href=„https://en.wikipedia.org/wiki/Special:BookSources/81-7758-404-9“ title=„Special:BookSources/81-7758-404-9“><bdi>81-7758-404-9</bdi></a>. <a href=„https://en.wikipedia.org/wiki/OCLC_(identifier)“ class=„mw-redirect“ title=„OCLC (identifier)“>OCLC</a> <a rel=„nofollow“ class=„external text“ href=„https://www.worldcat.org/oclc/818811849“>818811849</a>.</cite></li><li id=„cite_note-13“><b><a href=„https://en.wikipedia.org/wiki/Student%27s_t-test#cite_ref-13“>^</a></b> <link rel=„mw-deduplicated-inline-style“ href=„denied:mw-data:TemplateStyles:r1215172403“ /><cite id=„CITEREFRaju2005“ class=„citation journal cs1“>Raju, T. N. (2005). „William Sealy Gosset and William A. Silverman: Two 'Students' of Science“. <i><a href=„https://en.wikipedia.org/wiki/Pediatrics_(journal)“ title=„Pediatrics (journal)“>Pediatrics</a></i>. <b>116</b> (3): 732–735. <a href=„https://en.wikipedia.org/wiki/Doi_(identifier)“ class=„mw-redirect“ title=„Doi (identifier)“>doi</a>:<a rel=„nofollow“ class=„external text“ href=„https://doi.org/10.1542%2Fpeds.2005-1134“>10.1542/peds.2005-1134</a>. <a href=„https://en.wikipedia.org/wiki/PMID_(identifier)“ class=„mw-redirect“ title=„PMID (identifier)“>PMID</a> <a rel=„nofollow“ class=„external text“ href=„https://pubmed.ncbi.nlm.nih.gov/16140715“>16140715</a>. <a href=„https://en.wikipedia.org/wiki/S2CID_(identifier)“ class=„mw-redirect“ title=„S2CID (identifier)“>S2CID</a> <a rel=„nofollow“ class=„external text“ href=„https://api.semanticscholar.org/CorpusID:32745754“>32745754</a>.</cite></li><li id=„cite_note-Dodge2008-14“><b><a href=„https://en.wikipedia.org/wiki/Student%27s_t-test#cite_ref-Dodge2008_14-0“>^</a></b> <link rel=„mw-deduplicated-inline-style“ href=„denied:mw-data:TemplateStyles:r1215172403“ /><cite id=„CITEREFDodge2008“ class=„citation book cs1“><a href=„https://en.wikipedia.org/wiki/Yadolah_Dodge“ title=„Yadolah Dodge“>Dodge, Yadolah</a> (2008). <a rel=„nofollow“ class=„external text“ href=„https://books.google.com/books?id=k2zklGOBRDwC&pg=PA234“><i>The Concise Encyclopedia of Statistics</i></a>. Springer Science & Business Media. pp. 234–235. <a href=„https://en.wikipedia.org/wiki/ISBN_(identifier)“ class=„mw-redirect“ title=„ISBN (identifier)“>ISBN</a> <a href=„https://en.wikipedia.org/wiki/Special:BookSources/978-0-387-31742-7“ title=„Special:BookSources/978-0-387-31742-7“><bdi>978-0-387-31742-7</bdi></a>.</cite></li><li id=„cite_note-fadem-15“><b><a href=„https://en.wikipedia.org/wiki/Student%27s_t-test#cite_ref-fadem_15-0“>^</a></b> <link rel=„mw-deduplicated-inline-style“ href=„denied:mw-data:TemplateStyles:r1215172403“ /><cite id=„CITEREFFadem2008“ class=„citation book cs1“>Fadem, Barbara (2008). <i>High-Yield Behavioral Science</i>. High-Yield Series. Hagerstown, MD: Lippincott Williams & Wilkins. <a href=„https://en.wikipedia.org/wiki/ISBN_(identifier)“ class=„mw-redirect“ title=„ISBN (identifier)“>ISBN</a> <a href=„https://en.wikipedia.org/wiki/Special:BookSources/9781451130300“ title=„Special:BookSources/9781451130300“><bdi>9781451130300</bdi></a>.</cite></li><li id=„cite_note-16“><b><a href=„https://en.wikipedia.org/wiki/Student%27s_t-test#cite_ref-16“>^</a></b> <link rel=„mw-deduplicated-inline-style“ href=„denied:mw-data:TemplateStyles:r1215172403“ /><cite id=„CITEREFRice2006“ class=„citation book cs1“>Rice, John A. (2006). <i>Mathematical Statistics and Data Analysis</i> (3rd ed.). Duxbury Advanced.</cite></li><li id=„cite_note-17“><b><a href=„https://en.wikipedia.org/wiki/Student%27s_t-test#cite_ref-17“>^</a></b> <link rel=„mw-deduplicated-inline-style“ href=„denied:mw-data:TemplateStyles:r1215172403“ /><cite id=„CITEREFWeisstein“ class=„citation web cs1“>Weisstein, Eric. <a rel=„nofollow“ class=„external text“ href=„http://mathworld.wolfram.com/Studentst-Distribution.html“>„Student's t-Distribution“</a>. <i>mathworld.wolfram.com</i>.</cite></li><li id=„cite_note-18“><b><a href=„https://en.wikipedia.org/wiki/Student%27s_t-test#cite_ref-18“>^</a></b> <link rel=„mw-deduplicated-inline-style“ href=„denied:mw-data:TemplateStyles:r1215172403“ /><cite id=„CITEREFDavidGunnink1997“ class=„citation journal cs1“>David, H. A.; Gunnink, Jason L. (1997). „The Paired <i>t</i> Test Under Artificial Pairing“. <i>The American Statistician</i>. <b>51</b> (1): 9–12. <a href=„https://en.wikipedia.org/wiki/Doi_(identifier)“ class=„mw-redirect“ title=„Doi (identifier)“>doi</a>:<a rel=„nofollow“ class=„external text“ href=„https://doi.org/10.2307%2F2684684“>10.2307/2684684</a>. <a href=„https://en.wikipedia.org/wiki/JSTOR_(identifier)“ class=„mw-redirect“ title=„JSTOR (identifier)“>JSTOR</a> <a rel=„nofollow“ class=„external text“ href=„https://www.jstor.org/stable/2684684“>2684684</a>.</cite></li><li id=„cite_note-:0-19“>^ <a href=„https://en.wikipedia.org/wiki/Student%27s_t-test#cite_ref-:0_19-0“><i><b>a</b></i></a> <a href=„https://en.wikipedia.org/wiki/Student%27s_t-test#cite_ref-:0_19-1“><i><b>b</b></i></a> <a href=„https://en.wikipedia.org/wiki/Student%27s_t-test#cite_ref-:0_19-2“><i><b>c</b></i></a> <a href=„https://en.wikipedia.org/wiki/Student%27s_t-test#cite_ref-:0_19-3“><i><b>d</b></i></a> <link rel=„mw-deduplicated-inline-style“ href=„denied:mw-data:TemplateStyles:r1215172403“ /><cite id=„CITEREFLumleyDiehrEmersonChen2002“ class=„citation journal cs1“>Lumley, Thomas; <a href=„https://en.wikipedia.org/wiki/Paula_Diehr“ title=„Paula Diehr“>Diehr, Paula</a>; Emerson, Scott; Chen, Lu (May 2002). <a rel=„nofollow“ class=„external text“ href=„https://doi.org/10.1146%2Fannurev.publhealth.23.100901.140546“>„The Importance of the Normality Assumption in Large Public Health Data Sets“</a>. <i>Annual Review of Public Health</i>. <b>23</b> (1): 151–169. <a href=„https://en.wikipedia.org/wiki/Doi_(identifier)“ class=„mw-redirect“ title=„Doi (identifier)“>doi</a>:<a rel=„nofollow“ class=„external text“ href=„https://doi.org/10.1146%2Fannurev.publhealth.23.100901.140546“>10.1146/annurev.publhealth.23.100901.140546</a>. <a href=„https://en.wikipedia.org/wiki/ISSN_(identifier)“ class=„mw-redirect“ title=„ISSN (identifier)“>ISSN</a> <a rel=„nofollow“ class=„external text“ href=„https://www.worldcat.org/issn/0163-7525“>0163-7525</a>. <a href=„https://en.wikipedia.org/wiki/PMID_(identifier)“ class=„mw-redirect“ title=„PMID (identifier)“>PMID</a> <a rel=„nofollow“ class=„external text“ href=„https://pubmed.ncbi.nlm.nih.gov/11910059“>11910059</a>.</cite></li><li id=„cite_note-20“><b><a href=„https://en.wikipedia.org/wiki/Student%27s_t-test#cite_ref-20“>^</a></b> <link rel=„mw-deduplicated-inline-style“ href=„denied:mw-data:TemplateStyles:r1215172403“ /><cite id=„CITEREFMarkowskiMarkowski1990“ class=„citation journal cs1“>Markowski, Carol A.; Markowski, Edward P. (1990). „Conditions for the Effectiveness of a Preliminary Test of Variance“. <i>The American Statistician</i>. <b>44</b> (4): 322–326. <a href=„https://en.wikipedia.org/wiki/Doi_(identifier)“ class=„mw-redirect“ title=„Doi (identifier)“>doi</a>:<a rel=„nofollow“ class=„external text“ href=„https://doi.org/10.2307%2F2684360“>10.2307/2684360</a>. <a href=„https://en.wikipedia.org/wiki/JSTOR_(identifier)“ class=„mw-redirect“ title=„JSTOR (identifier)“>JSTOR</a> <a rel=„nofollow“ class=„external text“ href=„https://www.jstor.org/stable/2684360“>2684360</a>.</cite></li><li id=„cite_note-Guo2017-21“><b><a href=„https://en.wikipedia.org/wiki/Student%27s_t-test#cite_ref-Guo2017_21-0“>^</a></b> <link rel=„mw-deduplicated-inline-style“ href=„denied:mw-data:TemplateStyles:r1215172403“ /><cite id=„CITEREFGuoYuan2017“ class=„citation journal cs1“>Guo, Beibei; Yuan, Ying (2017). „A comparative review of methods for comparing means using partially paired data“. <i>Statistical Methods in Medical Research</i>. <b>26</b> (3): 1323–1340. <a href=„https://en.wikipedia.org/wiki/Doi_(identifier)“ class=„mw-redirect“ title=„Doi (identifier)“>doi</a>:<a rel=„nofollow“ class=„external text“ href=„https://doi.org/10.1177%2F0962280215577111“>10.1177/0962280215577111</a>. <a href=„https://en.wikipedia.org/wiki/PMID_(identifier)“ class=„mw-redirect“ title=„PMID (identifier)“>PMID</a> <a rel=„nofollow“ class=„external text“ href=„https://pubmed.ncbi.nlm.nih.gov/25834090“>25834090</a>. <a href=„https://en.wikipedia.org/wiki/S2CID_(identifier)“ class=„mw-redirect“ title=„S2CID (identifier)“>S2CID</a> <a rel=„nofollow“ class=„external text“ href=„https://api.semanticscholar.org/CorpusID:46598415“>46598415</a>.</cite></li><li id=„cite_note-Bland1995-22“><b><a href=„https://en.wikipedia.org/wiki/Student%27s_t-test#cite_ref-Bland1995_22-0“>^</a></b> <link rel=„mw-deduplicated-inline-style“ href=„denied:mw-data:TemplateStyles:r1215172403“ /><cite id=„CITEREFBland1995“ class=„citation book cs1“>Bland, Martin (1995). <a rel=„nofollow“ class=„external text“ href=„https://books.google.com/books?id=v6xpAAAAMAAJ“><i>An Introduction to Medical Statistics</i></a>. Oxford University Press. p. 168. <a href=„https://en.wikipedia.org/wiki/ISBN_(identifier)“ class=„mw-redirect“ title=„ISBN (identifier)“>ISBN</a> <a href=„https://en.wikipedia.org/wiki/Special:BookSources/978-0-19-262428-4“ title=„Special:BookSources/978-0-19-262428-4“><bdi>978-0-19-262428-4</bdi></a>.</cite></li><li id=„cite_note-23“><b><a href=„https://en.wikipedia.org/wiki/Student%27s_t-test#cite_ref-23“>^</a></b> <link rel=„mw-deduplicated-inline-style“ href=„denied:mw-data:TemplateStyles:r1215172403“ /><cite class=„citation web cs1“><a rel=„nofollow“ class=„external text“ href=„https://analyse-it.com/docs/user-guide/101/normality-central-limit-theorem“>„Central limit theorem and the normality assumption > Normality > Continuous distributions > Distribution > Statistical Reference Guide | Analyse-it® 6.15 documentation“</a>. <i>analyse-it.com</i>. Retrieved 2024-05-17.</cite></li><li id=„cite_note-24“><b><a href=„https://en.wikipedia.org/wiki/Student%27s_t-test#cite_ref-24“>^</a></b> <link rel=„mw-deduplicated-inline-style“ href=„denied:mw-data:TemplateStyles:r1215172403“ /><cite id=„CITEREFDEMİR2022“ class=„citation journal cs1“>DEMİR, Süleyman (2022-06-26). <a rel=„nofollow“ class=„external text“ href=„https://dx.doi.org/10.21449/ijate.1101295“>„Comparison of Normality Tests in Terms of Sample Sizes under Different Skewness and Kurtosis Coefficients“</a>. <i>International Journal of Assessment Tools in Education</i>. <b>9</b> (2): 397–409. <a href=„https://en.wikipedia.org/wiki/Doi_(identifier)“ class=„mw-redirect“ title=„Doi (identifier)“>doi</a>:<a rel=„nofollow“ class=„external text“ href=„https://doi.org/10.21449%2Fijate.1101295“>10.21449/ijate.1101295</a>. <a href=„https://en.wikipedia.org/wiki/ISSN_(identifier)“ class=„mw-redirect“ title=„ISSN (identifier)“>ISSN</a> <a rel=„nofollow“ class=„external text“ href=„https://www.worldcat.org/issn/2148-7456“>2148-7456</a>.</cite></li><li id=„cite_note-25“><b><a href=„https://en.wikipedia.org/wiki/Student%27s_t-test#cite_ref-25“>^</a></b> <link rel=„mw-deduplicated-inline-style“ href=„denied:mw-data:TemplateStyles:r1215172403“ /><cite id=„CITEREFWangJia2022“ class=„citation arxiv cs1“>Wang, Chang; Jia, Jinzhu (2022). „Te Test: A New Non-asymptotic T-test for Behrens-Fisher Problems“. <a href=„https://en.wikipedia.org/wiki/ArXiv_(identifier)“ class=„mw-redirect“ title=„ArXiv (identifier)“>arXiv</a>:<a rel=„nofollow“ class=„external text“ href=„https://arxiv.org/abs/2210.16473“>2210.16473</a> [<a rel=„nofollow“ class=„external text“ href=„https://arxiv.org/archive/math.ST“>math.ST</a>].</cite></li><li id=„cite_note-Sawilowsky-Blair-26“>^ <a href=„https://en.wikipedia.org/wiki/Student%27s_t-test#cite_ref-Sawilowsky-Blair_26-0“><i><b>a</b></i></a> <a href=„https://en.wikipedia.org/wiki/Student%27s_t-test#cite_ref-Sawilowsky-Blair_26-1“><i><b>b</b></i></a> <link rel=„mw-deduplicated-inline-style“ href=„denied:mw-data:TemplateStyles:r1215172403“ /><cite id=„CITEREFSawilowskyBlair1992“ class=„citation journal cs1“>Sawilowsky, Shlomo S.; Blair, R. Clifford (1992). „A More Realistic Look at the Robustness and Type II Error Properties of the <i>t</i> Test to Departures From Population Normality“. <i>Psychological Bulletin</i>. <b>111</b> (2): 352–360. <a href=„https://en.wikipedia.org/wiki/Doi_(identifier)“ class=„mw-redirect“ title=„Doi (identifier)“>doi</a>:<a rel=„nofollow“ class=„external text“ href=„https://doi.org/10.1037%2F0033-2909.111.2.352“>10.1037/0033-2909.111.2.352</a>.</cite></li><li id=„cite_note-27“><b><a href=„https://en.wikipedia.org/wiki/Student%27s_t-test#cite_ref-27“>^</a></b> <link rel=„mw-deduplicated-inline-style“ href=„denied:mw-data:TemplateStyles:r1215172403“ /><cite id=„CITEREFZimmerman1998“ class=„citation journal cs1“>Zimmerman, Donald W. (January 1998). „Invalidation of Parametric and Nonparametric Statistical Tests by Concurrent Violation of Two Assumptions“. <i>The Journal of Experimental Education</i>. <b>67</b> (1): 55–68. <a href=„https://en.wikipedia.org/wiki/Doi_(identifier)“ class=„mw-redirect“ title=„Doi (identifier)“>doi</a>:<a rel=„nofollow“ class=„external text“ href=„https://doi.org/10.1080%2F00220979809598344“>10.1080/00220979809598344</a>. <a href=„https://en.wikipedia.org/wiki/ISSN_(identifier)“ class=„mw-redirect“ title=„ISSN (identifier)“>ISSN</a> <a rel=„nofollow“ class=„external text“ href=„https://www.worldcat.org/issn/0022-0973“>0022-0973</a>.</cite></li><li id=„cite_note-28“><b><a href=„https://en.wikipedia.org/wiki/Student%27s_t-test#cite_ref-28“>^</a></b> <link rel=„mw-deduplicated-inline-style“ href=„denied:mw-data:TemplateStyles:r1215172403“ /><cite id=„CITEREFBlairHiggins1980“ class=„citation journal cs1“>Blair, R. Clifford; Higgins, James J. (1980). „A Comparison of the Power of Wilcoxon's Rank-Sum Statistic to That of Student's <i>t</i> Statistic Under Various Nonnormal Distributions“. <i>Journal of Educational Statistics</i>. <b>5</b> (4): 309–335. <a href=„https://en.wikipedia.org/wiki/Doi_(identifier)“ class=„mw-redirect“ title=„Doi (identifier)“>doi</a>:<a rel=„nofollow“ class=„external text“ href=„https://doi.org/10.2307%2F1164905“>10.2307/1164905</a>. <a href=„https://en.wikipedia.org/wiki/JSTOR_(identifier)“ class=„mw-redirect“ title=„JSTOR (identifier)“>JSTOR</a> <a rel=„nofollow“ class=„external text“ href=„https://www.jstor.org/stable/1164905“>1164905</a>.</cite></li><li id=„cite_note-29“><b><a href=„https://en.wikipedia.org/wiki/Student%27s_t-test#cite_ref-29“>^</a></b> <link rel=„mw-deduplicated-inline-style“ href=„denied:mw-data:TemplateStyles:r1215172403“ /><cite id=„CITEREFFayProschan2010“ class=„citation journal cs1“>Fay, Michael P.; Proschan, Michael A. (2010). <a rel=„nofollow“ class=„external text“ href=„http://www.i-journals.org/ss/viewarticle.php?id=51“>„Wilcoxon–Mann–Whitney or <i>t</i>-test? On assumptions for hypothesis tests and multiple interpretations of decision rules“</a>. <i>Statistics Surveys</i>. <b>4</b>: 1–39. <a href=„https://en.wikipedia.org/wiki/Doi_(identifier)“ class=„mw-redirect“ title=„Doi (identifier)“>doi</a>:<a rel=„nofollow“ class=„external text“ href=„https://doi.org/10.1214%2F09-SS051“>10.1214/09-SS051</a>. <a href=„https://en.wikipedia.org/wiki/PMC_(identifier)“ class=„mw-redirect“ title=„PMC (identifier)“>PMC</a> <a rel=„nofollow“ class=„external text“ href=„https://www.ncbi.nlm.nih.gov/pmc/articles/PMC2857732“>2857732</a>. <a href=„https://en.wikipedia.org/wiki/PMID_(identifier)“ class=„mw-redirect“ title=„PMID (identifier)“>PMID</a> <a rel=„nofollow“ class=„external text“ href=„https://pubmed.ncbi.nlm.nih.gov/20414472“>20414472</a>.</cite></li><li id=„cite_note-Partover-30“><b><a href=„https://en.wikipedia.org/wiki/Student%27s_t-test#cite_ref-Partover_30-0“>^</a></b> <link rel=„mw-deduplicated-inline-style“ href=„denied:mw-data:TemplateStyles:r1215172403“ /><cite id=„CITEREFDerrickToherWhite2017“ class=„citation journal cs1“>Derrick, B; Toher, D; White, P (2017). <a rel=„nofollow“ class=„external text“ href=„http://eprints.uwe.ac.uk/31765/1/How%20to%20compare%20means......%20BD_DT_PW.pdf“>„How to compare the means of two samples that include paired observations and independent observations: A companion to Derrick, Russ, Toher and White (2017)“</a> (PDF). <i>The Quantitative Methods for Psychology</i>. <b>13</b> (2): 120–126. <a href=„https://en.wikipedia.org/wiki/Doi_(identifier)“ class=„mw-redirect“ title=„Doi (identifier)“>doi</a>:<a rel=„nofollow“ class=„external text“ href=„https://doi.org/10.20982%2Ftqmp.13.2.p120“>10.20982/tqmp.13.2.p120</a>.</cite></li></ol></div></div><h2>Sources[<a href=„https://en.wikipedia.org/w/index.php?title=Student%27s_t-test&action=edit&section=27“ title=„Edit section: Sources“>edit</a>]</h2><style data-mw-deduplicate=„TemplateStyles:r1054258005“ scoped=„scoped“></style><div class=„refbegin“><ul><li><link rel=„mw-deduplicated-inline-style“ href=„denied:mw-data:TemplateStyles:r1215172403“ /><cite id=„CITEREFO'Mahony1986“ class=„citation book cs1“>O'Mahony, Michael (1986). <i>Sensory Evaluation of Food: Statistical Methods and Procedures</i>. <a href=„https://en.wikipedia.org/wiki/CRC_Press“ title=„CRC Press“>CRC Press</a>. p. 487. <a href=„https://en.wikipedia.org/wiki/ISBN_(identifier)“ class=„mw-redirect“ title=„ISBN (identifier)“>ISBN</a> <a href=„https://en.wikipedia.org/wiki/Special:BookSources/0-82477337-3“ title=„Special:BookSources/0-82477337-3“><bdi>0-82477337-3</bdi></a>.</cite></li><li><link rel=„mw-deduplicated-inline-style“ href=„denied:mw-data:TemplateStyles:r1215172403“ /><cite id=„CITEREFPressTeukolskyVetterlingFlannery1992“ class=„citation book cs1“>Press, William H.; Teukolsky, Saul A.; Vetterling, William T.; Flannery, Brian P. (1992). <a rel=„nofollow“ class=„external text“ href=„https://archive.org/details/numericalrecipes0865unse/page/616“><i>Numerical Recipes in C: The Art of Scientific Computing</i></a>. <a href=„https://en.wikipedia.org/wiki/Cambridge_University_Press“ title=„Cambridge University Press“>Cambridge University Press</a>. p. <a rel=„nofollow“ class=„external text“ href=„https://archive.org/details/numericalrecipes0865unse/page/616“>616</a>. <a href=„https://en.wikipedia.org/wiki/ISBN_(identifier)“ class=„mw-redirect“ title=„ISBN (identifier)“>ISBN</a> <a href=„https://en.wikipedia.org/wiki/Special:BookSources/0-521-43108-5“ title=„Special:BookSources/0-521-43108-5“><bdi>0-521-43108-5</bdi></a>.</cite></li></ul></div><h2>Further reading[<a href=„https://en.wikipedia.org/w/index.php?title=Student%27s_t-test&action=edit&section=28“ title=„Edit section: Further reading“>edit</a>]</h2><ul><li><link rel=„mw-deduplicated-inline-style“ href=„denied:mw-data:TemplateStyles:r1215172403“ /><cite id=„CITEREFBoneau1960“ class=„citation journal cs1“>Boneau, C. Alan (1960). „The effects of violations of assumptions underlying the <i>t</i> test“. <i>Psychological Bulletin</i>. <b>57</b> (1): 49–64. <a href=„https://en.wikipedia.org/wiki/Doi_(identifier)“ class=„mw-redirect“ title=„Doi (identifier)“>doi</a>:<a rel=„nofollow“ class=„external text“ href=„https://doi.org/10.1037%2Fh0041412“>10.1037/h0041412</a>. <a href=„https://en.wikipedia.org/wiki/PMID_(identifier)“ class=„mw-redirect“ title=„PMID (identifier)“>PMID</a> <a rel=„nofollow“ class=„external text“ href=„https://pubmed.ncbi.nlm.nih.gov/13802482“>13802482</a>.</cite></li><li><link rel=„mw-deduplicated-inline-style“ href=„denied:mw-data:TemplateStyles:r1215172403“ /><cite id=„CITEREFEdgellNoon1984“ class=„citation journal cs1“>Edgell, Stephen E.; Noon, Sheila M. (1984). „Effect of violation of normality on the <i>t</i> test of the correlation coefficient“. <i>Psychological Bulletin</i>. <b>95</b> (3): 576–583. <a href=„https://en.wikipedia.org/wiki/Doi_(identifier)“ class=„mw-redirect“ title=„Doi (identifier)“>doi</a>:<a rel=„nofollow“ class=„external text“ href=„https://doi.org/10.1037%2F0033-2909.95.3.576“>10.1037/0033-2909.95.3.576</a>.</cite></li></ul><h2>External links[<a href=„https://en.wikipedia.org/w/index.php?title=Student%27s_t-test&action=edit&section=29“ title=„Edit section: External links“>edit</a>]</h2><style data-mw-deduplicate=„TemplateStyles:r1217611005“ scoped=„scoped“></style><div class=„side-box side-box-right plainlinks sistersitebox“><style data-mw-deduplicate=„TemplateStyles:r1126788409“ scoped=„scoped“></style><div class=„side-box-flex“><div class=„side-box-image“><img alt=„“ src=„https://upload.wikimedia.org/wikipedia/commons/thumb/0/0b/Wikiversity_logo_2017.svg/40px-Wikiversity_logo_2017.svg.png“ width=„40“ height=„33“ class=„mw-file-element“ srcset=„upload.wikimedia.org/wikipedia/commons/thumb/0/0b/Wikiversity_logo_2017.svg/60px-Wikiversity_logo_2017.svg.png 1.5x, upload.wikimedia.org/wikipedia/commons/thumb/0/0b/Wikiversity_logo_2017.svg/80px-Wikiversity_logo_2017.svg.png 2x“ data-file-width=„626“ data-file-height=„512“ referrerpolicy=„no-referrer“ /></div><div class=„side-box-text plainlist“>Wikiversity has learning resources about <i><b><a href=„https://en.wikiversity.org/wiki/t-test“ class=„extiw“ title=„v:t-test“>t-test</a></b></i></div></div></div><link rel=„mw-deduplicated-inline-style“ href=„denied:mw-data:TemplateStyles:r1217611005“ /><div class=„side-box side-box-right plainlinks sistersitebox“><link rel=„mw-deduplicated-inline-style“ href=„denied:mw-data:TemplateStyles:r1126788409“ /><div class=„side-box-flex“><div class=„side-box-image“><img alt=„“ src=„https://upload.wikimedia.org/wikipedia/commons/thumb/4/4c/Wikisource-logo.svg/38px-Wikisource-logo.svg.png“ width=„38“ height=„40“ class=„mw-file-element“ srcset=„upload.wikimedia.org/wikipedia/commons/thumb/4/4c/Wikisource-logo.svg/57px-Wikisource-logo.svg.png 1.5x, upload.wikimedia.org/wikipedia/commons/thumb/4/4c/Wikisource-logo.svg/76px-Wikisource-logo.svg.png 2x“ data-file-width=„410“ data-file-height=„430“ referrerpolicy=„no-referrer“ /></div><div class=„side-box-text plainlist“><a href=„https://en.wikipedia.org/wiki/Wikisource“ title=„Wikisource“>Wikisource</a> has original text related to this article:<div><b><a href=„https://en.wikisource.org/wiki/The_Probable_Error_of_a_Mean“ class=„extiw“ title=„wikisource:The Probable Error of a Mean“>The Probable Error of a Mean</a></b></div></div></div></div><ul><li><link rel=„mw-deduplicated-inline-style“ href=„denied:mw-data:TemplateStyles:r1215172403“ /><cite class=„citation cs1“><a rel=„nofollow“ class=„external text“ href=„https://www.encyclopediaofmath.org/index.php?title=Student_test“>„Student test“</a>. <i><a href=„https://en.wikipedia.org/wiki/Encyclopedia_of_Mathematics“ title=„Encyclopedia of Mathematics“>Encyclopedia of Mathematics</a></i>. <a href=„https://en.wikipedia.org/wiki/European_Mathematical_Society“ title=„European Mathematical Society“>EMS Press</a>. 2001 [1994].</cite></li><li>Trochim, William M.K. „<a rel=„nofollow“ class=„external text“ href=„http://www.socialresearchmethods.net/kb/stat_t.php“>The T-Test</a>“, <i>Research Methods Knowledge Base</i>, conjoint.ly</li><li><a rel=„nofollow“ class=„external text“ href=„https://www.youtube.com/watch?v=sajXLvfolmg&list=PLD15D38DC7AA3B737&index=2#t=13m31s“>Econometrics lecture (topic: hypothesis testing)</a> on <a href=„https://en.wikipedia.org/wiki/YouTube_video_(identifier)“ class=„mw-redirect“ title=„YouTube video (identifier)“>YouTube</a> by <a href=„https://en.wikipedia.org/wiki/Mark_Thoma“ title=„Mark Thoma“>Mark Thoma</a></li></ul><div class=„navbox-styles“><style data-mw-deduplicate=„TemplateStyles:r1129693374“ scoped=„scoped“></style><style data-mw-deduplicate=„TemplateStyles:r1228936124“ scoped=„scoped“></style></div><div role=„navigation“ class=„navbox“ aria-labelledby=„Statistics“><table class=„nowraplinks hlist mw-collapsible uncollapsed navbox-inner“><tbody><tr><th scope=„col“ class=„navbox-title“ colspan=„2“><link rel=„mw-deduplicated-inline-style“ href=„denied:mw-data:TemplateStyles:r1129693374“ /><style data-mw-deduplicate=„TemplateStyles:r1063604349“ scoped=„scoped“></style><div class=„navbar plainlinks hlist navbar-mini“><ul><li class=„nv-view“><a href=„https://en.wikipedia.org/wiki/Template:Statistics“ title=„Template:Statistics“><abbr title=„View this template“>v</abbr></a></li><li class=„nv-talk“><a href=„https://en.wikipedia.org/wiki/Template_talk:Statistics“ title=„Template talk:Statistics“><abbr title=„Discuss this template“>t</abbr></a></li><li class=„nv-edit“><a href=„https://en.wikipedia.org/wiki/Special:EditPage/Template:Statistics“ title=„Special:EditPage/Template:Statistics“><abbr title=„Edit this template“>e</abbr></a></li></ul></div><div id=„Statistics“><a href=„https://en.wikipedia.org/wiki/Statistics“ title=„Statistics“>Statistics</a></div></th></tr><tr><td class=„navbox-abovebelow“ colspan=„2“><div><ul><li><a href=„https://en.wikipedia.org/wiki/Outline_of_statistics“ title=„Outline of statistics“>Outline</a></li><li><a href=„https://en.wikipedia.org/wiki/List_of_statistics_articles“ title=„List of statistics articles“>Index</a></li></ul></div></td></tr><tr><td colspan=„2“ class=„navbox-list navbox-odd“><table class=„nowraplinks mw-collapsible mw-collapsed navbox-subgroup“><tbody><tr><th scope=„col“ class=„navbox-title“ colspan=„2“><div id=„Descriptive_statistics“><a href=„https://en.wikipedia.org/wiki/Descriptive_statistics“ title=„Descriptive statistics“>Descriptive statistics</a></div></th></tr><tr><td colspan=„2“ class=„navbox-list navbox-odd“><table class=„nowraplinks navbox-subgroup“><tbody><tr><th scope=„row“ class=„navbox-group“><a href=„https://en.wikipedia.org/wiki/Continuous_probability_distribution“ class=„mw-redirect“ title=„Continuous probability distribution“>Continuous data</a></th><td class=„navbox-list-with-group navbox-list navbox-odd“><table class=„nowraplinks navbox-subgroup“><tbody><tr><th scope=„row“ class=„navbox-group“><a href=„https://en.wikipedia.org/wiki/Central_tendency“ title=„Central tendency“>Center</a></th><td class=„navbox-list-with-group navbox-list navbox-odd“><div><ul><li><a href=„https://en.wikipedia.org/wiki/Mean“ title=„Mean“>Mean</a><ul><li><a href=„https://en.wikipedia.org/wiki/Arithmetic_mean“ title=„Arithmetic mean“>Arithmetic</a></li><li><a href=„https://en.wikipedia.org/wiki/Arithmetic%E2%80%93geometric_mean“ title=„Arithmetic–geometric mean“>Arithmetic-Geometric</a></li><li><a href=„https://en.wikipedia.org/wiki/Cubic_mean“ title=„Cubic mean“>Cubic</a></li><li><a href=„https://en.wikipedia.org/wiki/Generalized_mean“ title=„Generalized mean“>Generalized/power</a></li><li><a href=„https://en.wikipedia.org/wiki/Geometric_mean“ title=„Geometric mean“>Geometric</a></li><li><a href=„https://en.wikipedia.org/wiki/Harmonic_mean“ title=„Harmonic mean“>Harmonic</a></li><li><a href=„https://en.wikipedia.org/wiki/Heronian_mean“ title=„Heronian mean“>Heronian</a></li><li><a href=„https://en.wikipedia.org/wiki/Heinz_mean“ title=„Heinz mean“>Heinz</a></li><li><a href=„https://en.wikipedia.org/wiki/Lehmer_mean“ title=„Lehmer mean“>Lehmer</a></li></ul></li><li><a href=„https://en.wikipedia.org/wiki/Median“ title=„Median“>Median</a></li><li><a href=„https://en.wikipedia.org/wiki/Mode_(statistics)“ title=„Mode (statistics)“>Mode</a></li></ul></div></td></tr><tr><th scope=„row“ class=„navbox-group“><a href=„https://en.wikipedia.org/wiki/Statistical_dispersion“ title=„Statistical dispersion“>Dispersion</a></th><td class=„navbox-list-with-group navbox-list navbox-even“><div><ul><li><a href=„https://en.wikipedia.org/wiki/Average_absolute_deviation“ title=„Average absolute deviation“>Average absolute deviation</a></li><li><a href=„https://en.wikipedia.org/wiki/Coefficient_of_variation“ title=„Coefficient of variation“>Coefficient of variation</a></li><li><a href=„https://en.wikipedia.org/wiki/Interquartile_range“ title=„Interquartile range“>Interquartile range</a></li><li><a href=„https://en.wikipedia.org/wiki/Percentile“ title=„Percentile“>Percentile</a></li><li><a href=„https://en.wikipedia.org/wiki/Range_(statistics)“ title=„Range (statistics)“>Range</a></li><li><a href=„https://en.wikipedia.org/wiki/Standard_deviation“ title=„Standard deviation“>Standard deviation</a></li><li><a href=„https://en.wikipedia.org/wiki/Variance#Sample_variance“ title=„Variance“>Variance</a></li></ul></div></td></tr><tr><th scope=„row“ class=„navbox-group“><a href=„https://en.wikipedia.org/wiki/Shape_of_the_distribution“ class=„mw-redirect“ title=„Shape of the distribution“>Shape</a></th><td class=„navbox-list-with-group navbox-list navbox-odd“><div><ul><li><a href=„https://en.wikipedia.org/wiki/Central_limit_theorem“ title=„Central limit theorem“>Central limit theorem</a></li><li><a href=„https://en.wikipedia.org/wiki/Moment_(mathematics)“ title=„Moment (mathematics)“>Moments</a><ul><li><a href=„https://en.wikipedia.org/wiki/Kurtosis“ title=„Kurtosis“>Kurtosis</a></li><li><a href=„https://en.wikipedia.org/wiki/L-moment“ title=„L-moment“>L-moments</a></li><li><a href=„https://en.wikipedia.org/wiki/Skewness“ title=„Skewness“>Skewness</a></li></ul></li></ul></div></td></tr></tbody></table></td></tr><tr><th scope=„row“ class=„navbox-group“><a href=„https://en.wikipedia.org/wiki/Count_data“ title=„Count data“>Count data</a></th><td class=„navbox-list-with-group navbox-list navbox-even“><div><ul><li><a href=„https://en.wikipedia.org/wiki/Index_of_dispersion“ title=„Index of dispersion“>Index of dispersion</a></li></ul></div></td></tr><tr><th scope=„row“ class=„navbox-group“>Summary tables</th><td class=„navbox-list-with-group navbox-list navbox-odd“><div><ul><li><a href=„https://en.wikipedia.org/wiki/Contingency_table“ title=„Contingency table“>Contingency table</a></li><li><a href=„https://en.wikipedia.org/wiki/Frequency_distribution“ class=„mw-redirect“ title=„Frequency distribution“>Frequency distribution</a></li><li><a href=„https://en.wikipedia.org/wiki/Grouped_data“ title=„Grouped data“>Grouped data</a></li></ul></div></td></tr><tr><th scope=„row“ class=„navbox-group“><a href=„https://en.wikipedia.org/wiki/Correlation_and_dependence“ class=„mw-redirect“ title=„Correlation and dependence“>Dependence</a></th><td class=„navbox-list-with-group navbox-list navbox-even“><div><ul><li><a href=„https://en.wikipedia.org/wiki/Partial_correlation“ title=„Partial correlation“>Partial correlation</a></li><li><a href=„https://en.wikipedia.org/wiki/Pearson_correlation_coefficient“ title=„Pearson correlation coefficient“>Pearson product-moment correlation</a></li><li><a href=„https://en.wikipedia.org/wiki/Rank_correlation“ title=„Rank correlation“>Rank correlation</a><ul><li><a href=„https://en.wikipedia.org/wiki/Kendall_rank_correlation_coefficient“ title=„Kendall rank correlation coefficient“>Kendall's τ</a></li><li><a href=„https://en.wikipedia.org/wiki/Spearman%27s_rank_correlation_coefficient“ title=„Spearman's rank correlation coefficient“>Spearman's ρ</a></li></ul></li><li><a href=„https://en.wikipedia.org/wiki/Scatter_plot“ title=„Scatter plot“>Scatter plot</a></li></ul></div></td></tr><tr><th scope=„row“ class=„navbox-group“><a href=„https://en.wikipedia.org/wiki/Statistical_graphics“ title=„Statistical graphics“>Graphics</a></th><td class=„navbox-list-with-group navbox-list navbox-odd“><div><ul><li><a href=„https://en.wikipedia.org/wiki/Bar_chart“ title=„Bar chart“>Bar chart</a></li><li><a href=„https://en.wikipedia.org/wiki/Biplot“ title=„Biplot“>Biplot</a></li><li><a href=„https://en.wikipedia.org/wiki/Box_plot“ title=„Box plot“>Box plot</a></li><li><a href=„https://en.wikipedia.org/wiki/Control_chart“ title=„Control chart“>Control chart</a></li><li><a href=„https://en.wikipedia.org/wiki/Correlogram“ title=„Correlogram“>Correlogram</a></li><li><a href=„https://en.wikipedia.org/wiki/Fan_chart_(statistics)“ title=„Fan chart (statistics)“>Fan chart</a></li><li><a href=„https://en.wikipedia.org/wiki/Forest_plot“ title=„Forest plot“>Forest plot</a></li><li><a href=„https://en.wikipedia.org/wiki/Histogram“ title=„Histogram“>Histogram</a></li><li><a href=„https://en.wikipedia.org/wiki/Pie_chart“ title=„Pie chart“>Pie chart</a></li><li><a href=„https://en.wikipedia.org/wiki/Q%E2%80%93Q_plot“ title=„Q–Q plot“>Q–Q plot</a></li><li><a href=„https://en.wikipedia.org/wiki/Radar_chart“ title=„Radar chart“>Radar chart</a></li><li><a href=„https://en.wikipedia.org/wiki/Run_chart“ title=„Run chart“>Run chart</a></li><li><a href=„https://en.wikipedia.org/wiki/Scatter_plot“ title=„Scatter plot“>Scatter plot</a></li><li><a href=„https://en.wikipedia.org/wiki/Stem-and-leaf_display“ title=„Stem-and-leaf display“>Stem-and-leaf display</a></li><li><a href=„https://en.wikipedia.org/wiki/Violin_plot“ title=„Violin plot“>Violin plot</a></li></ul></div></td></tr></tbody></table></td></tr></tbody></table></td></tr><tr><td colspan=„2“ class=„navbox-list navbox-odd“><table class=„nowraplinks mw-collapsible mw-collapsed navbox-subgroup“><tbody><tr><th scope=„col“ class=„navbox-title“ colspan=„2“><div id=„Data_collection“><a href=„https://en.wikipedia.org/wiki/Data_collection“ title=„Data collection“>Data collection</a></div></th></tr><tr><td colspan=„2“ class=„navbox-list navbox-odd“><table class=„nowraplinks navbox-subgroup“><tbody><tr><th scope=„row“ class=„navbox-group“><a href=„https://en.wikipedia.org/wiki/Design_of_experiments“ title=„Design of experiments“>Study design</a></th><td class=„navbox-list-with-group navbox-list navbox-odd“><div><ul><li><a href=„https://en.wikipedia.org/wiki/Effect_size“ title=„Effect size“>Effect size</a></li><li><a href=„https://en.wikipedia.org/wiki/Missing_data“ title=„Missing data“>Missing data</a></li><li><a href=„https://en.wikipedia.org/wiki/Optimal_design“ class=„mw-redirect“ title=„Optimal design“>Optimal design</a></li><li><a href=„https://en.wikipedia.org/wiki/Statistical_population“ title=„Statistical population“>Population</a></li><li><a href=„https://en.wikipedia.org/wiki/Replication_(statistics)“ title=„Replication (statistics)“>Replication</a></li><li><a href=„https://en.wikipedia.org/wiki/Sample_size_determination“ title=„Sample size determination“>Sample size determination</a></li><li><a href=„https://en.wikipedia.org/wiki/Statistic“ title=„Statistic“>Statistic</a></li><li><a href=„https://en.wikipedia.org/wiki/Statistical_power“ class=„mw-redirect“ title=„Statistical power“>Statistical power</a></li></ul></div></td></tr><tr><th scope=„row“ class=„navbox-group“><a href=„https://en.wikipedia.org/wiki/Survey_methodology“ title=„Survey methodology“>Survey methodology</a></th><td class=„navbox-list-with-group navbox-list navbox-even“><div><ul><li><a href=„https://en.wikipedia.org/wiki/Sampling_(statistics)“ title=„Sampling (statistics)“>Sampling</a><ul><li><a href=„https://en.wikipedia.org/wiki/Cluster_sampling“ title=„Cluster sampling“>Cluster</a></li><li><a href=„https://en.wikipedia.org/wiki/Stratified_sampling“ title=„Stratified sampling“>Stratified</a></li></ul></li><li><a href=„https://en.wikipedia.org/wiki/Opinion_poll“ title=„Opinion poll“>Opinion poll</a></li><li><a href=„https://en.wikipedia.org/wiki/Questionnaire“ title=„Questionnaire“>Questionnaire</a></li><li><a href=„https://en.wikipedia.org/wiki/Standard_error“ title=„Standard error“>Standard error</a></li></ul></div></td></tr><tr><th scope=„row“ class=„navbox-group“><a href=„https://en.wikipedia.org/wiki/Experiment“ title=„Experiment“>Controlled experiments</a></th><td class=„navbox-list-with-group navbox-list navbox-odd“><div><ul><li><a href=„https://en.wikipedia.org/wiki/Blocking_(statistics)“ title=„Blocking (statistics)“>Blocking</a></li><li><a href=„https://en.wikipedia.org/wiki/Factorial_experiment“ title=„Factorial experiment“>Factorial experiment</a></li><li><a href=„https://en.wikipedia.org/wiki/Interaction_(statistics)“ title=„Interaction (statistics)“>Interaction</a></li><li><a href=„https://en.wikipedia.org/wiki/Random_assignment“ title=„Random assignment“>Random assignment</a></li><li><a href=„https://en.wikipedia.org/wiki/Randomized_controlled_trial“ title=„Randomized controlled trial“>Randomized controlled trial</a></li><li><a href=„https://en.wikipedia.org/wiki/Randomized_experiment“ title=„Randomized experiment“>Randomized experiment</a></li><li><a href=„https://en.wikipedia.org/wiki/Scientific_control“ title=„Scientific control“>Scientific control</a></li></ul></div></td></tr><tr><th scope=„row“ class=„navbox-group“>Adaptive designs</th><td class=„navbox-list-with-group navbox-list navbox-even“><div><ul><li><a href=„https://en.wikipedia.org/wiki/Adaptive_clinical_trial“ class=„mw-redirect“ title=„Adaptive clinical trial“>Adaptive clinical trial</a></li><li><a href=„https://en.wikipedia.org/wiki/Stochastic_approximation“ title=„Stochastic approximation“>Stochastic approximation</a></li><li><a href=„https://en.wikipedia.org/wiki/Up-and-Down_Designs“ class=„mw-redirect“ title=„Up-and-Down Designs“>Up-and-down designs</a></li></ul></div></td></tr><tr><th scope=„row“ class=„navbox-group“><a href=„https://en.wikipedia.org/wiki/Observational_study“ title=„Observational study“>Observational studies</a></th><td class=„navbox-list-with-group navbox-list navbox-odd“><div><ul><li><a href=„https://en.wikipedia.org/wiki/Cohort_study“ title=„Cohort study“>Cohort study</a></li><li><a href=„https://en.wikipedia.org/wiki/Cross-sectional_study“ title=„Cross-sectional study“>Cross-sectional study</a></li><li><a href=„https://en.wikipedia.org/wiki/Natural_experiment“ title=„Natural experiment“>Natural experiment</a></li><li><a href=„https://en.wikipedia.org/wiki/Quasi-experiment“ title=„Quasi-experiment“>Quasi-experiment</a></li></ul></div></td></tr></tbody></table></td></tr></tbody></table></td></tr><tr><td colspan=„2“ class=„navbox-list navbox-odd“><table class=„nowraplinks mw-collapsible uncollapsed navbox-subgroup“><tbody><tr><th scope=„col“ class=„navbox-title“ colspan=„2“><div id=„Statistical_inference“><a href=„https://en.wikipedia.org/wiki/Statistical_inference“ title=„Statistical inference“>Statistical inference</a></div></th></tr><tr><td colspan=„2“ class=„navbox-list navbox-odd“><table class=„nowraplinks navbox-subgroup“><tbody><tr><th scope=„row“ class=„navbox-group“><a href=„https://en.wikipedia.org/wiki/Statistical_theory“ title=„Statistical theory“>Statistical theory</a></th><td class=„navbox-list-with-group navbox-list navbox-odd“><div><ul><li><a href=„https://en.wikipedia.org/wiki/Population_(statistics)“ class=„mw-redirect“ title=„Population (statistics)“>Population</a></li><li><a href=„https://en.wikipedia.org/wiki/Statistic“ title=„Statistic“>Statistic</a></li><li><a href=„https://en.wikipedia.org/wiki/Probability_distribution“ title=„Probability distribution“>Probability distribution</a></li><li><a href=„https://en.wikipedia.org/wiki/Sampling_distribution“ title=„Sampling distribution“>Sampling distribution</a><ul><li><a href=„https://en.wikipedia.org/wiki/Order_statistic“ title=„Order statistic“>Order statistic</a></li></ul></li><li><a href=„https://en.wikipedia.org/wiki/Empirical_distribution_function“ title=„Empirical distribution function“>Empirical distribution</a><ul><li><a href=„https://en.wikipedia.org/wiki/Density_estimation“ title=„Density estimation“>Density estimation</a></li></ul></li><li><a href=„https://en.wikipedia.org/wiki/Statistical_model“ title=„Statistical model“>Statistical model</a><ul><li><a href=„https://en.wikipedia.org/wiki/Model_specification“ class=„mw-redirect“ title=„Model specification“>Model specification</a></li><li><a href=„https://en.wikipedia.org/wiki/Lp_space“ title=„Lp space“>L<i>p</i> space</a></li></ul></li><li><a href=„https://en.wikipedia.org/wiki/Statistical_parameter“ title=„Statistical parameter“>Parameter</a><ul><li><a href=„https://en.wikipedia.org/wiki/Location_parameter“ title=„Location parameter“>location</a></li><li><a href=„https://en.wikipedia.org/wiki/Scale_parameter“ title=„Scale parameter“>scale</a></li><li><a href=„https://en.wikipedia.org/wiki/Shape_parameter“ title=„Shape parameter“>shape</a></li></ul></li><li><a href=„https://en.wikipedia.org/wiki/Parametric_statistics“ title=„Parametric statistics“>Parametric family</a><ul><li><a href=„https://en.wikipedia.org/wiki/Likelihood_function“ title=„Likelihood function“>Likelihood</a> <a href=„https://en.wikipedia.org/wiki/Monotone_likelihood_ratio“ title=„Monotone likelihood ratio“>(monotone)</a></li><li><a href=„https://en.wikipedia.org/wiki/Location%E2%80%93scale_family“ title=„Location–scale family“>Location–scale family</a></li><li><a href=„https://en.wikipedia.org/wiki/Exponential_family“ title=„Exponential family“>Exponential family</a></li></ul></li><li><a href=„https://en.wikipedia.org/wiki/Completeness_(statistics)“ title=„Completeness (statistics)“>Completeness</a></li><li><a href=„https://en.wikipedia.org/wiki/Sufficient_statistic“ title=„Sufficient statistic“>Sufficiency</a></li><li><a href=„https://en.wikipedia.org/wiki/Plug-in_principle“ class=„mw-redirect“ title=„Plug-in principle“>Statistical functional</a><ul><li><a href=„https://en.wikipedia.org/wiki/Bootstrapping_(statistics)“ title=„Bootstrapping (statistics)“>Bootstrap</a></li><li><a href=„https://en.wikipedia.org/wiki/U-statistic“ title=„U-statistic“>U</a></li><li><a href=„https://en.wikipedia.org/wiki/V-statistic“ title=„V-statistic“>V</a></li></ul></li><li><a href=„https://en.wikipedia.org/wiki/Optimal_decision“ title=„Optimal decision“>Optimal decision</a><ul><li><a href=„https://en.wikipedia.org/wiki/Loss_function“ title=„Loss function“>loss function</a></li></ul></li><li><a href=„https://en.wikipedia.org/wiki/Efficiency_(statistics)“ title=„Efficiency (statistics)“>Efficiency</a></li><li><a href=„https://en.wikipedia.org/wiki/Statistical_distance“ title=„Statistical distance“>Statistical distance</a><ul><li><a href=„https://en.wikipedia.org/wiki/Divergence_(statistics)“ title=„Divergence (statistics)“>divergence</a></li></ul></li><li><a href=„https://en.wikipedia.org/wiki/Asymptotic_theory_(statistics)“ title=„Asymptotic theory (statistics)“>Asymptotics</a></li><li><a href=„https://en.wikipedia.org/wiki/Robust_statistics“ title=„Robust statistics“>Robustness</a></li></ul></div></td></tr><tr><th scope=„row“ class=„navbox-group“><a href=„https://en.wikipedia.org/wiki/Frequentist_inference“ title=„Frequentist inference“>Frequentist inference</a></th><td class=„navbox-list-with-group navbox-list navbox-odd“><table class=„nowraplinks navbox-subgroup“><tbody><tr><th scope=„row“ class=„navbox-group“><a href=„https://en.wikipedia.org/wiki/Point_estimation“ title=„Point estimation“>Point estimation</a></th><td class=„navbox-list-with-group navbox-list navbox-even“><div><ul><li><a href=„https://en.wikipedia.org/wiki/Estimating_equations“ title=„Estimating equations“>Estimating equations</a><ul><li><a href=„https://en.wikipedia.org/wiki/Maximum_likelihood“ class=„mw-redirect“ title=„Maximum likelihood“>Maximum likelihood</a></li><li><a href=„https://en.wikipedia.org/wiki/Method_of_moments_(statistics)“ title=„Method of moments (statistics)“>Method of moments</a></li><li><a href=„https://en.wikipedia.org/wiki/M-estimator“ title=„M-estimator“>M-estimator</a></li><li><a href=„https://en.wikipedia.org/wiki/Minimum_distance_estimation“ class=„mw-redirect“ title=„Minimum distance estimation“>Minimum distance</a></li></ul></li><li><a href=„https://en.wikipedia.org/wiki/Bias_of_an_estimator“ title=„Bias of an estimator“>Unbiased estimators</a><ul><li><a href=„https://en.wikipedia.org/wiki/Minimum-variance_unbiased_estimator“ title=„Minimum-variance unbiased estimator“>Mean-unbiased minimum-variance</a><ul><li><a href=„https://en.wikipedia.org/wiki/Rao%E2%80%93Blackwell_theorem“ title=„Rao–Blackwell theorem“>Rao–Blackwellization</a></li><li><a href=„https://en.wikipedia.org/wiki/Lehmann%E2%80%93Scheff%C3%A9_theorem“ title=„Lehmann–Scheffé theorem“>Lehmann–Scheffé theorem</a></li></ul></li><li><a href=„https://en.wikipedia.org/wiki/Median-unbiased_estimator“ class=„mw-redirect“ title=„Median-unbiased estimator“>Median unbiased</a></li></ul></li><li><a href=„https://en.wikipedia.org/wiki/Plug-in_principle“ class=„mw-redirect“ title=„Plug-in principle“>Plug-in</a></li></ul></div></td></tr><tr><th scope=„row“ class=„navbox-group“><a href=„https://en.wikipedia.org/wiki/Interval_estimation“ title=„Interval estimation“>Interval estimation</a></th><td class=„navbox-list-with-group navbox-list navbox-odd“><div><ul><li><a href=„https://en.wikipedia.org/wiki/Confidence_interval“ title=„Confidence interval“>Confidence interval</a></li><li><a href=„https://en.wikipedia.org/wiki/Pivotal_quantity“ title=„Pivotal quantity“>Pivot</a></li><li><a href=„https://en.wikipedia.org/wiki/Likelihood_interval“ class=„mw-redirect“ title=„Likelihood interval“>Likelihood interval</a></li><li><a href=„https://en.wikipedia.org/wiki/Prediction_interval“ title=„Prediction interval“>Prediction interval</a></li><li><a href=„https://en.wikipedia.org/wiki/Tolerance_interval“ title=„Tolerance interval“>Tolerance interval</a></li><li><a href=„https://en.wikipedia.org/wiki/Resampling_(statistics)“ title=„Resampling (statistics)“>Resampling</a><ul><li><a href=„https://en.wikipedia.org/wiki/Bootstrapping_(statistics)“ title=„Bootstrapping (statistics)“>Bootstrap</a></li><li><a href=„https://en.wikipedia.org/wiki/Jackknife_resampling“ title=„Jackknife resampling“>Jackknife</a></li></ul></li></ul></div></td></tr><tr><th scope=„row“ class=„navbox-group“><a href=„https://en.wikipedia.org/wiki/Statistical_hypothesis_testing“ class=„mw-redirect“ title=„Statistical hypothesis testing“>Testing hypotheses</a></th><td class=„navbox-list-with-group navbox-list navbox-even“><div><ul><li><a href=„https://en.wikipedia.org/wiki/One-_and_two-tailed_tests“ title=„One- and two-tailed tests“>1- & 2-tails</a></li><li><a href=„https://en.wikipedia.org/wiki/Power_(statistics)“ class=„mw-redirect“ title=„Power (statistics)“>Power</a><ul><li><a href=„https://en.wikipedia.org/wiki/Uniformly_most_powerful_test“ title=„Uniformly most powerful test“>Uniformly most powerful test</a></li></ul></li><li><a href=„https://en.wikipedia.org/wiki/Permutation_test“ title=„Permutation test“>Permutation test</a><ul><li><a href=„https://en.wikipedia.org/wiki/Randomization_test“ class=„mw-redirect“ title=„Randomization test“>Randomization test</a></li></ul></li><li><a href=„https://en.wikipedia.org/wiki/Multiple_comparisons“ class=„mw-redirect“ title=„Multiple comparisons“>Multiple comparisons</a></li></ul></div></td></tr><tr><th scope=„row“ class=„navbox-group“><a href=„https://en.wikipedia.org/wiki/Parametric_statistics“ title=„Parametric statistics“>Parametric tests</a></th><td class=„navbox-list-with-group navbox-list navbox-odd“><div><ul><li><a href=„https://en.wikipedia.org/wiki/Likelihood-ratio_test“ title=„Likelihood-ratio test“>Likelihood-ratio</a></li><li><a href=„https://en.wikipedia.org/wiki/Score_test“ title=„Score test“>Score/Lagrange multiplier</a></li><li><a href=„https://en.wikipedia.org/wiki/Wald_test“ title=„Wald test“>Wald</a></li></ul></div></td></tr></tbody></table></td></tr><tr><th scope=„row“ class=„navbox-group“><a href=„https://en.wikipedia.org/wiki/List_of_statistical_tests“ title=„List of statistical tests“>Specific tests</a></th><td class=„navbox-list-with-group navbox-list navbox-odd“><table class=„nowraplinks navbox-subgroup“><tbody><tr><td colspan=„2“ class=„navbox-list navbox-even“><div><ul><li><a href=„https://en.wikipedia.org/wiki/Z-test“ title=„Z-test“><i>Z</i>-test (normal)</a></li><li><a class=„mw-selflink selflink“>Student's <i>t</i>-test</a></li><li><a href=„https://en.wikipedia.org/wiki/F-test“ title=„F-test“><i>F</i>-test</a></li></ul></div></td></tr><tr><th scope=„row“ class=„navbox-group“><a href=„https://en.wikipedia.org/wiki/Goodness_of_fit“ title=„Goodness of fit“>Goodness of fit</a></th><td class=„navbox-list-with-group navbox-list navbox-odd“><div><ul><li><a href=„https://en.wikipedia.org/wiki/Chi-squared_test“ title=„Chi-squared test“>Chi-squared</a></li><li><a href=„https://en.wikipedia.org/wiki/G-test“ title=„G-test“><i>G</i>-test</a></li><li><a href=„https://en.wikipedia.org/wiki/Kolmogorov%E2%80%93Smirnov_test“ title=„Kolmogorov–Smirnov test“>Kolmogorov–Smirnov</a></li><li><a href=„https://en.wikipedia.org/wiki/Anderson%E2%80%93Darling_test“ title=„Anderson–Darling test“>Anderson–Darling</a></li><li><a href=„https://en.wikipedia.org/wiki/Lilliefors_test“ title=„Lilliefors test“>Lilliefors</a></li><li><a href=„https://en.wikipedia.org/wiki/Jarque%E2%80%93Bera_test“ title=„Jarque–Bera test“>Jarque–Bera</a></li><li><a href=„https://en.wikipedia.org/wiki/Shapiro%E2%80%93Wilk_test“ title=„Shapiro–Wilk test“>Normality (Shapiro–Wilk)</a></li><li><a href=„https://en.wikipedia.org/wiki/Likelihood-ratio_test“ title=„Likelihood-ratio test“>Likelihood-ratio test</a></li><li><a href=„https://en.wikipedia.org/wiki/Model_selection“ title=„Model selection“>Model selection</a><ul><li><a href=„https://en.wikipedia.org/wiki/Cross-validation_(statistics)“ title=„Cross-validation (statistics)“>Cross validation</a></li><li><a href=„https://en.wikipedia.org/wiki/Akaike_information_criterion“ title=„Akaike information criterion“>AIC</a></li><li><a href=„https://en.wikipedia.org/wiki/Bayesian_information_criterion“ title=„Bayesian information criterion“>BIC</a></li></ul></li></ul></div></td></tr><tr><th scope=„row“ class=„navbox-group“><a href=„https://en.wikipedia.org/wiki/Rank_statistics“ class=„mw-redirect“ title=„Rank statistics“>Rank statistics</a></th><td class=„navbox-list-with-group navbox-list navbox-even“><div><ul><li><a href=„https://en.wikipedia.org/wiki/Sign_test“ title=„Sign test“>Sign</a><ul><li><a href=„https://en.wikipedia.org/wiki/Sample_median“ class=„mw-redirect“ title=„Sample median“>Sample median</a></li></ul></li><li><a href=„https://en.wikipedia.org/wiki/Wilcoxon_signed-rank_test“ title=„Wilcoxon signed-rank test“>Signed rank (Wilcoxon)</a><ul><li><a href=„https://en.wikipedia.org/wiki/Hodges%E2%80%93Lehmann_estimator“ title=„Hodges–Lehmann estimator“>Hodges–Lehmann estimator</a></li></ul></li><li><a href=„https://en.wikipedia.org/wiki/Mann%E2%80%93Whitney_U_test“ title=„Mann–Whitney U test“>Rank sum (Mann–Whitney)</a></li><li><a href=„https://en.wikipedia.org/wiki/Nonparametric_statistics“ title=„Nonparametric statistics“>Nonparametric</a> <a href=„https://en.wikipedia.org/wiki/Analysis_of_variance“ title=„Analysis of variance“>anova</a><ul><li><a href=„https://en.wikipedia.org/wiki/Kruskal%E2%80%93Wallis_test“ title=„Kruskal–Wallis test“>1-way (Kruskal–Wallis)</a></li><li><a href=„https://en.wikipedia.org/wiki/Friedman_test“ title=„Friedman test“>2-way (Friedman)</a></li><li><a href=„https://en.wikipedia.org/wiki/Jonckheere%27s_trend_test“ title=„Jonckheere's trend test“>Ordered alternative (Jonckheere–Terpstra)</a></li></ul></li><li><a href=„https://en.wikipedia.org/wiki/Van_der_Waerden_test“ title=„Van der Waerden test“>Van der Waerden test</a></li></ul></div></td></tr></tbody></table></td></tr><tr><th scope=„row“ class=„navbox-group“><a href=„https://en.wikipedia.org/wiki/Bayesian_inference“ title=„Bayesian inference“>Bayesian inference</a></th><td class=„navbox-list-with-group navbox-list navbox-odd“><div><ul><li><a href=„https://en.wikipedia.org/wiki/Bayesian_probability“ title=„Bayesian probability“>Bayesian probability</a><ul><li><a href=„https://en.wikipedia.org/wiki/Prior_probability“ title=„Prior probability“>prior</a></li><li><a href=„https://en.wikipedia.org/wiki/Posterior_probability“ title=„Posterior probability“>posterior</a></li></ul></li><li><a href=„https://en.wikipedia.org/wiki/Credible_interval“ title=„Credible interval“>Credible interval</a></li><li><a href=„https://en.wikipedia.org/wiki/Bayes_factor“ title=„Bayes factor“>Bayes factor</a></li><li><a href=„https://en.wikipedia.org/wiki/Bayes_estimator“ title=„Bayes estimator“>Bayesian estimator</a><ul><li><a href=„https://en.wikipedia.org/wiki/Maximum_a_posteriori_estimation“ title=„Maximum a posteriori estimation“>Maximum posterior estimator</a></li></ul></li></ul></div></td></tr></tbody></table></td></tr></tbody></table></td></tr><tr><td colspan=„2“ class=„navbox-list navbox-odd“><table class=„nowraplinks mw-collapsible mw-collapsed navbox-subgroup“><tbody><tr><th scope=„col“ class=„navbox-title“ colspan=„2“><div id=„CorrelationRegression_analysis“><div class=„hlist“><ul><li><a href=„https://en.wikipedia.org/wiki/Correlation_and_dependence“ class=„mw-redirect“ title=„Correlation and dependence“>Correlation</a></li><li><a href=„https://en.wikipedia.org/wiki/Regression_analysis“ title=„Regression analysis“>Regression analysis</a></li></ul></div></div></th></tr><tr><td colspan=„2“ class=„navbox-list navbox-odd“><table class=„nowraplinks navbox-subgroup“><tbody><tr><th scope=„row“ class=„navbox-group“><a href=„https://en.wikipedia.org/wiki/Correlation_and_dependence“ class=„mw-redirect“ title=„Correlation and dependence“>Correlation</a></th><td class=„navbox-list-with-group navbox-list navbox-odd“><div><ul><li><a href=„https://en.wikipedia.org/wiki/Pearson_product-moment_correlation_coefficient“ class=„mw-redirect“ title=„Pearson product-moment correlation coefficient“>Pearson product-moment</a></li><li><a href=„https://en.wikipedia.org/wiki/Partial_correlation“ title=„Partial correlation“>Partial correlation</a></li><li><a href=„https://en.wikipedia.org/wiki/Confounding“ title=„Confounding“>Confounding variable</a></li><li><a href=„https://en.wikipedia.org/wiki/Coefficient_of_determination“ title=„Coefficient of determination“>Coefficient of determination</a></li></ul></div></td></tr><tr><th scope=„row“ class=„navbox-group“><a href=„https://en.wikipedia.org/wiki/Regression_analysis“ title=„Regression analysis“>Regression analysis</a></th><td class=„navbox-list-with-group navbox-list navbox-even“><div><ul><li><a href=„https://en.wikipedia.org/wiki/Errors_and_residuals“ title=„Errors and residuals“>Errors and residuals</a></li><li><a href=„https://en.wikipedia.org/wiki/Regression_validation“ title=„Regression validation“>Regression validation</a></li><li><a href=„https://en.wikipedia.org/wiki/Mixed_model“ title=„Mixed model“>Mixed effects models</a></li><li><a href=„https://en.wikipedia.org/wiki/Simultaneous_equations_model“ title=„Simultaneous equations model“>Simultaneous equations models</a></li><li><a href=„https://en.wikipedia.org/wiki/Multivariate_adaptive_regression_splines“ class=„mw-redirect“ title=„Multivariate adaptive regression splines“>Multivariate adaptive regression splines (MARS)</a></li></ul></div></td></tr><tr><th scope=„row“ class=„navbox-group“><a href=„https://en.wikipedia.org/wiki/Linear_regression“ title=„Linear regression“>Linear regression</a></th><td class=„navbox-list-with-group navbox-list navbox-odd“><div><ul><li><a href=„https://en.wikipedia.org/wiki/Simple_linear_regression“ title=„Simple linear regression“>Simple linear regression</a></li><li><a href=„https://en.wikipedia.org/wiki/Ordinary_least_squares“ title=„Ordinary least squares“>Ordinary least squares</a></li><li><a href=„https://en.wikipedia.org/wiki/General_linear_model“ title=„General linear model“>General linear model</a></li><li><a href=„https://en.wikipedia.org/wiki/Bayesian_linear_regression“ title=„Bayesian linear regression“>Bayesian regression</a></li></ul></div></td></tr><tr><th scope=„row“ class=„navbox-group“>Non-standard predictors</th><td class=„navbox-list-with-group navbox-list navbox-even“><div><ul><li><a href=„https://en.wikipedia.org/wiki/Nonlinear_regression“ title=„Nonlinear regression“>Nonlinear regression</a></li><li><a href=„https://en.wikipedia.org/wiki/Nonparametric_regression“ title=„Nonparametric regression“>Nonparametric</a></li><li><a href=„https://en.wikipedia.org/wiki/Semiparametric_regression“ title=„Semiparametric regression“>Semiparametric</a></li><li><a href=„https://en.wikipedia.org/wiki/Isotonic_regression“ title=„Isotonic regression“>Isotonic</a></li><li><a href=„https://en.wikipedia.org/wiki/Robust_regression“ title=„Robust regression“>Robust</a></li><li><a href=„https://en.wikipedia.org/wiki/Heteroscedasticity“ class=„mw-redirect“ title=„Heteroscedasticity“>Heteroscedasticity</a></li><li><a href=„https://en.wikipedia.org/wiki/Homoscedasticity“ class=„mw-redirect“ title=„Homoscedasticity“>Homoscedasticity</a></li></ul></div></td></tr><tr><th scope=„row“ class=„navbox-group“><a href=„https://en.wikipedia.org/wiki/Generalized_linear_model“ title=„Generalized linear model“>Generalized linear model</a></th><td class=„navbox-list-with-group navbox-list navbox-odd“><div><ul><li><a href=„https://en.wikipedia.org/wiki/Exponential_family“ title=„Exponential family“>Exponential families</a></li><li><a href=„https://en.wikipedia.org/wiki/Logistic_regression“ title=„Logistic regression“>Logistic (Bernoulli)</a> / <a href=„https://en.wikipedia.org/wiki/Binomial_regression“ title=„Binomial regression“>Binomial</a> / <a href=„https://en.wikipedia.org/wiki/Poisson_regression“ title=„Poisson regression“>Poisson regressions</a></li></ul></div></td></tr><tr><th scope=„row“ class=„navbox-group“><a href=„https://en.wikipedia.org/wiki/Partition_of_sums_of_squares“ title=„Partition of sums of squares“>Partition of variance</a></th><td class=„navbox-list-with-group navbox-list navbox-even“><div><ul><li><a href=„https://en.wikipedia.org/wiki/Analysis_of_variance“ title=„Analysis of variance“>Analysis of variance (ANOVA, anova)</a></li><li><a href=„https://en.wikipedia.org/wiki/Analysis_of_covariance“ title=„Analysis of covariance“>Analysis of covariance</a></li><li><a href=„https://en.wikipedia.org/wiki/Multivariate_analysis_of_variance“ title=„Multivariate analysis of variance“>Multivariate ANOVA</a></li><li><a href=„https://en.wikipedia.org/wiki/Degrees_of_freedom_(statistics)“ title=„Degrees of freedom (statistics)“>Degrees of freedom</a></li></ul></div></td></tr></tbody></table></td></tr></tbody></table></td></tr><tr><td colspan=„2“ class=„navbox-list navbox-odd“><table class=„nowraplinks mw-collapsible mw-collapsed navbox-subgroup“><tbody><tr><th scope=„col“ class=„navbox-title“ colspan=„2“><div id=„Categorical_/_Multivariate_/_Time-series_/_Survival_analysis“><a href=„https://en.wikipedia.org/wiki/Categorical_variable“ title=„Categorical variable“>Categorical</a> / <a href=„https://en.wikipedia.org/wiki/Multivariate_statistics“ title=„Multivariate statistics“>Multivariate</a> / <a href=„https://en.wikipedia.org/wiki/Time_series“ title=„Time series“>Time-series</a> / <a href=„https://en.wikipedia.org/wiki/Survival_analysis“ title=„Survival analysis“>Survival analysis</a></div></th></tr><tr><td colspan=„2“ class=„navbox-list navbox-odd“><table class=„nowraplinks navbox-subgroup“><tbody><tr><th scope=„row“ class=„navbox-group“><a href=„https://en.wikipedia.org/wiki/Categorical_variable“ title=„Categorical variable“>Categorical</a></th><td class=„navbox-list-with-group navbox-list navbox-odd“><div><ul><li><a href=„https://en.wikipedia.org/wiki/Cohen%27s_kappa“ title=„Cohen's kappa“>Cohen's kappa</a></li><li><a href=„https://en.wikipedia.org/wiki/Contingency_table“ title=„Contingency table“>Contingency table</a></li><li><a href=„https://en.wikipedia.org/wiki/Graphical_model“ title=„Graphical model“>Graphical model</a></li><li><a href=„https://en.wikipedia.org/wiki/Poisson_regression“ title=„Poisson regression“>Log-linear model</a></li><li><a href=„https://en.wikipedia.org/wiki/McNemar%27s_test“ title=„McNemar's test“>McNemar's test</a></li><li><a href=„https://en.wikipedia.org/wiki/Cochran%E2%80%93Mantel%E2%80%93Haenszel_statistics“ title=„Cochran–Mantel–Haenszel statistics“>Cochran–Mantel–Haenszel statistics</a></li></ul></div></td></tr><tr><th scope=„row“ class=„navbox-group“><a href=„https://en.wikipedia.org/wiki/Multivariate_statistics“ title=„Multivariate statistics“>Multivariate</a></th><td class=„navbox-list-with-group navbox-list navbox-even“><div><ul><li><a href=„https://en.wikipedia.org/wiki/General_linear_model“ title=„General linear model“>Regression</a></li><li><a href=„https://en.wikipedia.org/wiki/Multivariate_analysis_of_variance“ title=„Multivariate analysis of variance“>Manova</a></li><li><a href=„https://en.wikipedia.org/wiki/Principal_component_analysis“ title=„Principal component analysis“>Principal components</a></li><li><a href=„https://en.wikipedia.org/wiki/Canonical_correlation“ title=„Canonical correlation“>Canonical correlation</a></li><li><a href=„https://en.wikipedia.org/wiki/Linear_discriminant_analysis“ title=„Linear discriminant analysis“>Discriminant analysis</a></li><li><a href=„https://en.wikipedia.org/wiki/Cluster_analysis“ title=„Cluster analysis“>Cluster analysis</a></li><li><a href=„https://en.wikipedia.org/wiki/Statistical_classification“ title=„Statistical classification“>Classification</a></li><li><a href=„https://en.wikipedia.org/wiki/Structural_equation_modeling“ title=„Structural equation modeling“>Structural equation model</a><ul><li><a href=„https://en.wikipedia.org/wiki/Factor_analysis“ title=„Factor analysis“>Factor analysis</a></li></ul></li><li><a href=„https://en.wikipedia.org/wiki/Multivariate_distribution“ class=„mw-redirect“ title=„Multivariate distribution“>Multivariate distributions</a><ul><li><a href=„https://en.wikipedia.org/wiki/Elliptical_distribution“ title=„Elliptical distribution“>Elliptical distributions</a><ul><li><a href=„https://en.wikipedia.org/wiki/Multivariate_normal_distribution“ title=„Multivariate normal distribution“>Normal</a></li></ul></li></ul></li></ul></div></td></tr><tr><th scope=„row“ class=„navbox-group“><a href=„https://en.wikipedia.org/wiki/Time_series“ title=„Time series“>Time-series</a></th><td class=„navbox-list-with-group navbox-list navbox-odd“><table class=„nowraplinks navbox-subgroup“><tbody><tr><th scope=„row“ class=„navbox-group“>General</th><td class=„navbox-list-with-group navbox-list navbox-odd“><div><ul><li><a href=„https://en.wikipedia.org/wiki/Decomposition_of_time_series“ title=„Decomposition of time series“>Decomposition</a></li><li><a href=„https://en.wikipedia.org/wiki/Trend_estimation“ class=„mw-redirect“ title=„Trend estimation“>Trend</a></li><li><a href=„https://en.wikipedia.org/wiki/Stationary_process“ title=„Stationary process“>Stationarity</a></li><li><a href=„https://en.wikipedia.org/wiki/Seasonal_adjustment“ title=„Seasonal adjustment“>Seasonal adjustment</a></li><li><a href=„https://en.wikipedia.org/wiki/Exponential_smoothing“ title=„Exponential smoothing“>Exponential smoothing</a></li><li><a href=„https://en.wikipedia.org/wiki/Cointegration“ title=„Cointegration“>Cointegration</a></li><li><a href=„https://en.wikipedia.org/wiki/Structural_break“ title=„Structural break“>Structural break</a></li><li><a href=„https://en.wikipedia.org/wiki/Granger_causality“ title=„Granger causality“>Granger causality</a></li></ul></div></td></tr><tr><th scope=„row“ class=„navbox-group“>Specific tests</th><td class=„navbox-list-with-group navbox-list navbox-even“><div><ul><li><a href=„https://en.wikipedia.org/wiki/Dickey%E2%80%93Fuller_test“ title=„Dickey–Fuller test“>Dickey–Fuller</a></li><li><a href=„https://en.wikipedia.org/wiki/Johansen_test“ title=„Johansen test“>Johansen</a></li><li><a href=„https://en.wikipedia.org/wiki/Ljung%E2%80%93Box_test“ title=„Ljung–Box test“>Q-statistic (Ljung–Box)</a></li><li><a href=„https://en.wikipedia.org/wiki/Durbin%E2%80%93Watson_statistic“ title=„Durbin–Watson statistic“>Durbin–Watson</a></li><li><a href=„https://en.wikipedia.org/wiki/Breusch%E2%80%93Godfrey_test“ title=„Breusch–Godfrey test“>Breusch–Godfrey</a></li></ul></div></td></tr><tr><th scope=„row“ class=„navbox-group“><a href=„https://en.wikipedia.org/wiki/Time_domain“ title=„Time domain“>Time domain</a></th><td class=„navbox-list-with-group navbox-list navbox-odd“><div><ul><li><a href=„https://en.wikipedia.org/wiki/Autocorrelation“ title=„Autocorrelation“>Autocorrelation (ACF)</a><ul><li><a href=„https://en.wikipedia.org/wiki/Partial_autocorrelation_function“ title=„Partial autocorrelation function“>partial (PACF)</a></li></ul></li><li><a href=„https://en.wikipedia.org/wiki/Cross-correlation“ title=„Cross-correlation“>Cross-correlation (XCF)</a></li><li><a href=„https://en.wikipedia.org/wiki/Autoregressive%E2%80%93moving-average_model“ class=„mw-redirect“ title=„Autoregressive–moving-average model“>ARMA model</a></li><li><a href=„https://en.wikipedia.org/wiki/Box%E2%80%93Jenkins_method“ title=„Box–Jenkins method“>ARIMA model (Box–Jenkins)</a></li><li><a href=„https://en.wikipedia.org/wiki/Autoregressive_conditional_heteroskedasticity“ title=„Autoregressive conditional heteroskedasticity“>Autoregressive conditional heteroskedasticity (ARCH)</a></li><li><a href=„https://en.wikipedia.org/wiki/Vector_autoregression“ title=„Vector autoregression“>Vector autoregression (VAR)</a></li></ul></div></td></tr><tr><th scope=„row“ class=„navbox-group“><a href=„https://en.wikipedia.org/wiki/Frequency_domain“ title=„Frequency domain“>Frequency domain</a></th><td class=„navbox-list-with-group navbox-list navbox-even“><div><ul><li><a href=„https://en.wikipedia.org/wiki/Spectral_density_estimation“ title=„Spectral density estimation“>Spectral density estimation</a></li><li><a href=„https://en.wikipedia.org/wiki/Fourier_analysis“ title=„Fourier analysis“>Fourier analysis</a></li><li><a href=„https://en.wikipedia.org/wiki/Least-squares_spectral_analysis“ title=„Least-squares spectral analysis“>Least-squares spectral analysis</a></li><li><a href=„https://en.wikipedia.org/wiki/Wavelet“ title=„Wavelet“>Wavelet</a></li><li><a href=„https://en.wikipedia.org/wiki/Whittle_likelihood“ title=„Whittle likelihood“>Whittle likelihood</a></li></ul></div></td></tr></tbody></table></td></tr><tr><th scope=„row“ class=„navbox-group“><a href=„https://en.wikipedia.org/wiki/Survival_analysis“ title=„Survival analysis“>Survival</a></th><td class=„navbox-list-with-group navbox-list navbox-odd“><table class=„nowraplinks navbox-subgroup“><tbody><tr><th scope=„row“ class=„navbox-group“><a href=„https://en.wikipedia.org/wiki/Survival_function“ title=„Survival function“>Survival function</a></th><td class=„navbox-list-with-group navbox-list navbox-odd“><div><ul><li><a href=„https://en.wikipedia.org/wiki/Kaplan%E2%80%93Meier_estimator“ title=„Kaplan–Meier estimator“>Kaplan–Meier estimator (product limit)</a></li><li><a href=„https://en.wikipedia.org/wiki/Proportional_hazards_model“ title=„Proportional hazards model“>Proportional hazards models</a></li><li><a href=„https://en.wikipedia.org/wiki/Accelerated_failure_time_model“ title=„Accelerated failure time model“>Accelerated failure time (AFT) model</a></li><li><a href=„https://en.wikipedia.org/wiki/First-hitting-time_model“ title=„First-hitting-time model“>First hitting time</a></li></ul></div></td></tr><tr><th scope=„row“ class=„navbox-group“><a href=„https://en.wikipedia.org/wiki/Failure_rate“ title=„Failure rate“>Hazard function</a></th><td class=„navbox-list-with-group navbox-list navbox-even“><div><ul><li><a href=„https://en.wikipedia.org/wiki/Nelson%E2%80%93Aalen_estimator“ title=„Nelson–Aalen estimator“>Nelson–Aalen estimator</a></li></ul></div></td></tr><tr><th scope=„row“ class=„navbox-group“>Test</th><td class=„navbox-list-with-group navbox-list navbox-odd“><div><ul><li><a href=„https://en.wikipedia.org/wiki/Log-rank_test“ class=„mw-redirect“ title=„Log-rank test“>Log-rank test</a></li></ul></div></td></tr></tbody></table></td></tr></tbody></table></td></tr></tbody></table></td></tr><tr><td colspan=„2“ class=„navbox-list navbox-odd“><table class=„nowraplinks mw-collapsible mw-collapsed navbox-subgroup“><tbody><tr><th scope=„col“ class=„navbox-title“ colspan=„2“><div id=„Applications“><a href=„https://en.wikipedia.org/wiki/List_of_fields_of_application_of_statistics“ title=„List of fields of application of statistics“>Applications</a></div></th></tr><tr><td colspan=„2“ class=„navbox-list navbox-odd“><table class=„nowraplinks navbox-subgroup“><tbody><tr><th scope=„row“ class=„navbox-group“><a href=„https://en.wikipedia.org/wiki/Biostatistics“ title=„Biostatistics“>Biostatistics</a></th><td class=„navbox-list-with-group navbox-list navbox-odd“><div><ul><li><a href=„https://en.wikipedia.org/wiki/Bioinformatics“ title=„Bioinformatics“>Bioinformatics</a></li><li><a href=„https://en.wikipedia.org/wiki/Clinical_trial“ title=„Clinical trial“>Clinical trials</a> / <a href=„https://en.wikipedia.org/wiki/Clinical_study_design“ title=„Clinical study design“>studies</a></li><li><a href=„https://en.wikipedia.org/wiki/Epidemiology“ title=„Epidemiology“>Epidemiology</a></li><li><a href=„https://en.wikipedia.org/wiki/Medical_statistics“ title=„Medical statistics“>Medical statistics</a></li></ul></div></td></tr><tr><th scope=„row“ class=„navbox-group“><a href=„https://en.wikipedia.org/wiki/Engineering_statistics“ title=„Engineering statistics“>Engineering statistics</a></th><td class=„navbox-list-with-group navbox-list navbox-even“><div><ul><li><a href=„https://en.wikipedia.org/wiki/Chemometrics“ title=„Chemometrics“>Chemometrics</a></li><li><a href=„https://en.wikipedia.org/wiki/Methods_engineering“ title=„Methods engineering“>Methods engineering</a></li><li><a href=„https://en.wikipedia.org/wiki/Probabilistic_design“ title=„Probabilistic design“>Probabilistic design</a></li><li><a href=„https://en.wikipedia.org/wiki/Statistical_process_control“ title=„Statistical process control“>Process</a> / <a href=„https://en.wikipedia.org/wiki/Quality_control“ title=„Quality control“>quality control</a></li><li><a href=„https://en.wikipedia.org/wiki/Reliability_engineering“ title=„Reliability engineering“>Reliability</a></li><li><a href=„https://en.wikipedia.org/wiki/System_identification“ title=„System identification“>System identification</a></li></ul></div></td></tr><tr><th scope=„row“ class=„navbox-group“><a href=„https://en.wikipedia.org/wiki/Social_statistics“ title=„Social statistics“>Social statistics</a></th><td class=„navbox-list-with-group navbox-list navbox-odd“><div><ul><li><a href=„https://en.wikipedia.org/wiki/Actuarial_science“ title=„Actuarial science“>Actuarial science</a></li><li><a href=„https://en.wikipedia.org/wiki/Census“ title=„Census“>Census</a></li><li><a href=„https://en.wikipedia.org/wiki/Crime_statistics“ title=„Crime statistics“>Crime statistics</a></li><li><a href=„https://en.wikipedia.org/wiki/Demographic_statistics“ title=„Demographic statistics“>Demography</a></li><li><a href=„https://en.wikipedia.org/wiki/Econometrics“ title=„Econometrics“>Econometrics</a></li><li><a href=„https://en.wikipedia.org/wiki/Jurimetrics“ title=„Jurimetrics“>Jurimetrics</a></li><li><a href=„https://en.wikipedia.org/wiki/National_accounts“ title=„National accounts“>National accounts</a></li><li><a href=„https://en.wikipedia.org/wiki/Official_statistics“ title=„Official statistics“>Official statistics</a></li><li><a href=„https://en.wikipedia.org/wiki/Population_statistics“ class=„mw-redirect“ title=„Population statistics“>Population statistics</a></li><li><a href=„https://en.wikipedia.org/wiki/Psychometrics“ title=„Psychometrics“>Psychometrics</a></li></ul></div></td></tr><tr><th scope=„row“ class=„navbox-group“><a href=„https://en.wikipedia.org/wiki/Spatial_analysis“ title=„Spatial analysis“>Spatial statistics</a></th><td class=„navbox-list-with-group navbox-list navbox-even“><div><ul><li><a href=„https://en.wikipedia.org/wiki/Cartography“ title=„Cartography“>Cartography</a></li><li><a href=„https://en.wikipedia.org/wiki/Environmental_statistics“ title=„Environmental statistics“>Environmental statistics</a></li><li><a href=„https://en.wikipedia.org/wiki/Geographic_information_system“ title=„Geographic information system“>Geographic information system</a></li><li><a href=„https://en.wikipedia.org/wiki/Geostatistics“ title=„Geostatistics“>Geostatistics</a></li><li><a href=„https://en.wikipedia.org/wiki/Kriging“ title=„Kriging“>Kriging</a></li></ul></div></td></tr></tbody></table></td></tr></tbody></table></td></tr><tr><td class=„navbox-abovebelow“ colspan=„2“><div><ul><li><img alt=„“ src=„https://upload.wikimedia.org/wikipedia/en/thumb/9/96/Symbol_category_class.svg/16px-Symbol_category_class.svg.png“ width=„16“ height=„16“ class=„mw-file-element“ srcset=„upload.wikimedia.org/wikipedia/en/thumb/9/96/Symbol_category_class.svg/23px-Symbol_category_class.svg.png 1.5x, upload.wikimedia.org/wikipedia/en/thumb/9/96/Symbol_category_class.svg/31px-Symbol_category_class.svg.png 2x“ data-file-width=„180“ data-file-height=„185“ referrerpolicy=„no-referrer“ /><b><a href=„https://en.wikipedia.org/wiki/Category:Statistics“ title=„Category:Statistics“>Category</a></b></li><li><b><a href=„https://en.wikipedia.org/wiki/File:Nuvola_apps_edu_mathematics_blue-p.svg“ class=„mw-file-description“><img alt=„icon“ src=„https://upload.wikimedia.org/wikipedia/commons/thumb/3/3e/Nuvola_apps_edu_mathematics_blue-p.svg/28px-Nuvola_apps_edu_mathematics_blue-p.svg.png“ width=„28“ height=„28“ class=„mw-file-element“ srcset=„upload.wikimedia.org/wikipedia/commons/thumb/3/3e/Nuvola_apps_edu_mathematics_blue-p.svg/42px-Nuvola_apps_edu_mathematics_blue-p.svg.png 1.5x, upload.wikimedia.org/wikipedia/commons/thumb/3/3e/Nuvola_apps_edu_mathematics_blue-p.svg/56px-Nuvola_apps_edu_mathematics_blue-p.svg.png 2x“ data-file-width=„128“ data-file-height=„128“ referrerpolicy=„no-referrer“ /></a> <a href=„https://en.wikipedia.org/wiki/Portal:Mathematics“ title=„Portal:Mathematics“>Mathematics portal</a></b></li><li><img alt=„“ src=„https://upload.wikimedia.org/wikipedia/en/thumb/4/4a/Commons-logo.svg/12px-Commons-logo.svg.png“ width=„12“ height=„16“ class=„mw-file-element“ srcset=„upload.wikimedia.org/wikipedia/en/thumb/4/4a/Commons-logo.svg/18px-Commons-logo.svg.png 1.5x, upload.wikimedia.org/wikipedia/en/thumb/4/4a/Commons-logo.svg/24px-Commons-logo.svg.png 2x“ data-file-width=„1024“ data-file-height=„1376“ referrerpolicy=„no-referrer“ /><b><a href=„https://commons.wikimedia.org/wiki/Category:Statistics“ class=„extiw“ title=„commons:Category:Statistics“>Commons</a></b></li><li><img alt=„“ src=„https://upload.wikimedia.org/wikipedia/commons/thumb/3/37/People_icon.svg/16px-People_icon.svg.png“ width=„16“ height=„16“ class=„mw-file-element“ srcset=„upload.wikimedia.org/wikipedia/commons/thumb/3/37/People_icon.svg/24px-People_icon.svg.png 1.5x, upload.wikimedia.org/wikipedia/commons/thumb/3/37/People_icon.svg/32px-People_icon.svg.png 2x“ data-file-width=„100“ data-file-height=„100“ referrerpolicy=„no-referrer“ /><b><a href=„https://en.wikipedia.org/wiki/Wikipedia:WikiProject_Statistics“ title=„Wikipedia:WikiProject Statistics“>WikiProject</a></b></li></ul></div></td></tr></tbody></table></div><div class=„navbox-styles“><link rel=„mw-deduplicated-inline-style“ href=„denied:mw-data:TemplateStyles:r1129693374“ /><link rel=„mw-deduplicated-inline-style“ href=„denied:mw-data:TemplateStyles:r1228936124“ /></div><div role=„navigation“ class=„navbox“ aria-labelledby=„Public_health“><table class=„nowraplinks hlist mw-collapsible autocollapse navbox-inner“><tbody><tr><th scope=„col“ class=„navbox-title“ colspan=„2“><link rel=„mw-deduplicated-inline-style“ href=„denied:mw-data:TemplateStyles:r1129693374“ /><link rel=„mw-deduplicated-inline-style“ href=„denied:mw-data:TemplateStyles:r1063604349“ /><div class=„navbar plainlinks hlist navbar-mini“><ul><li class=„nv-view“><a href=„https://en.wikipedia.org/wiki/Template:Public_health“ title=„Template:Public health“><abbr title=„View this template“>v</abbr></a></li><li class=„nv-talk“><a href=„https://en.wikipedia.org/wiki/Template_talk:Public_health“ title=„Template talk:Public health“><abbr title=„Discuss this template“>t</abbr></a></li><li class=„nv-edit“><a href=„https://en.wikipedia.org/wiki/Special:EditPage/Template:Public_health“ title=„Special:EditPage/Template:Public health“><abbr title=„Edit this template“>e</abbr></a></li></ul></div><div id=„Public_health“><a href=„https://en.wikipedia.org/wiki/Public_health“ title=„Public health“>Public health</a></div></th></tr><tr><th scope=„row“ class=„navbox-group“>General</th><td class=„navbox-list-with-group navbox-list navbox-odd“><div><ul><li><a href=„https://en.wikipedia.org/wiki/Auxology“ title=„Auxology“>Auxology</a></li><li><a href=„https://en.wikipedia.org/wiki/Biological_hazard“ title=„Biological hazard“>Biological hazard</a></li><li><a href=„https://en.wikipedia.org/wiki/Chief_Medical_Officer“ class=„mw-redirect“ title=„Chief Medical Officer“>Chief Medical Officer</a></li><li><a href=„https://en.wikipedia.org/wiki/Cultural_competence_in_health_care“ class=„mw-redirect“ title=„Cultural competence in health care“>Cultural competence</a></li><li><a href=„https://en.wikipedia.org/wiki/Deviance_(sociology)“ title=„Deviance (sociology)“>Deviance</a></li><li><a href=„https://en.wikipedia.org/wiki/Environmental_health“ title=„Environmental health“>Environmental health</a></li><li><a href=„https://en.wikipedia.org/wiki/Euthenics“ title=„Euthenics“>Euthenics</a></li><li><a href=„https://en.wikipedia.org/wiki/Public_health_genomics“ title=„Public health genomics“>Genomics</a></li><li><a href=„https://en.wikipedia.org/wiki/Globalization_and_disease“ title=„Globalization and disease“>Globalization and disease</a></li><li><a href=„https://en.wikipedia.org/wiki/Harm_reduction“ title=„Harm reduction“>Harm reduction</a></li><li><a href=„https://en.wikipedia.org/wiki/Health_economics“ title=„Health economics“>Health economics</a></li><li><a href=„https://en.wikipedia.org/wiki/Health_literacy“ title=„Health literacy“>Health literacy</a></li><li><a href=„https://en.wikipedia.org/wiki/Health_policy“ title=„Health policy“>Health policy</a><ul><li><a href=„https://en.wikipedia.org/wiki/Health_system“ title=„Health system“>Health system</a></li><li><a href=„https://en.wikipedia.org/wiki/Health_care_reform“ title=„Health care reform“>Health care reform</a></li></ul></li><li><a href=„https://en.wikipedia.org/wiki/Management_of_depression“ title=„Management of depression“>Management of depression</a><ul><li><a href=„https://en.wikipedia.org/wiki/Public_health_law“ title=„Public health law“>Public health law</a></li><li><a href=„https://en.wikipedia.org/wiki/National_public_health_institutes“ class=„mw-redirect“ title=„National public health institutes“>National public health institute</a></li></ul></li><li><a href=„https://en.wikipedia.org/wiki/Health_politics“ title=„Health politics“>Health politics</a></li><li><a href=„https://en.wikipedia.org/wiki/Maternal_health“ title=„Maternal health“>Maternal health</a></li><li><a href=„https://en.wikipedia.org/wiki/Medical_anthropology“ title=„Medical anthropology“>Medical anthropology</a></li><li><a href=„https://en.wikipedia.org/wiki/Medical_sociology“ title=„Medical sociology“>Medical sociology</a></li><li><a href=„https://en.wikipedia.org/wiki/Mental_health“ title=„Mental health“>Mental health</a> (<a href=„https://en.wikipedia.org/wiki/Minister_of_Mental_Health“ title=„Minister of Mental Health“>Ministers</a>)</li><li><a href=„https://en.wikipedia.org/wiki/Pharmaceutical_policy“ title=„Pharmaceutical policy“>Pharmaceutical policy</a></li><li><a href=„https://en.wikipedia.org/wiki/Pollution“ title=„Pollution“>Pollution</a><ul><li><a href=„https://en.wikipedia.org/wiki/Air_pollution“ title=„Air pollution“>Air</a></li><li><a href=„https://en.wikipedia.org/wiki/Water_pollution“ title=„Water pollution“>Water</a></li><li><a href=„https://en.wikipedia.org/wiki/Soil_pollution“ class=„mw-redirect“ title=„Soil pollution“>Soil</a></li><li><a href=„https://en.wikipedia.org/wiki/Radioactive_contamination“ title=„Radioactive contamination“>Radiation</a></li><li><a href=„https://en.wikipedia.org/wiki/Light_pollution“ title=„Light pollution“>Light</a></li></ul></li><li><a href=„https://en.wikipedia.org/wiki/Public_health_intervention“ title=„Public health intervention“>Public health intervention</a></li><li><a href=„https://en.wikipedia.org/wiki/Public_health_laboratory“ title=„Public health laboratory“>Public health laboratory</a></li><li><a href=„https://en.wikipedia.org/wiki/Sexual_and_reproductive_health“ title=„Sexual and reproductive health“>Sexual and reproductive health</a></li><li><a href=„https://en.wikipedia.org/wiki/Social_psychology“ title=„Social psychology“>Social psychology</a></li><li><a href=„https://en.wikipedia.org/wiki/Sociology_of_health_and_illness“ title=„Sociology of health and illness“>Sociology of health and illness</a></li></ul></div></td></tr><tr><th scope=„row“ class=„navbox-group“><a href=„https://en.wikipedia.org/wiki/Preventive_healthcare“ title=„Preventive healthcare“>Preventive healthcare</a></th><td class=„navbox-list-with-group navbox-list navbox-even“><div><ul><li><a href=„https://en.wikipedia.org/wiki/Behavior_change_(public_health)“ title=„Behavior change (public health)“>Behavior change</a><ul><li><a href=„https://en.wikipedia.org/wiki/Behavioural_change_theories“ title=„Behavioural change theories“>Theories</a></li></ul></li><li><a href=„https://en.wikipedia.org/wiki/Family_planning“ title=„Family planning“>Family planning</a></li><li><a href=„https://en.wikipedia.org/wiki/Health_promotion“ title=„Health promotion“>Health promotion</a></li><li><a href=„https://en.wikipedia.org/wiki/Human_nutrition“ title=„Human nutrition“>Human nutrition</a><ul><li><a href=„https://en.wikipedia.org/wiki/Healthy_diet“ title=„Healthy diet“>Healthy diet</a></li><li><a href=„https://en.wikipedia.org/wiki/Preventive_nutrition“ title=„Preventive nutrition“>Preventive nutrition</a></li></ul></li><li><a href=„https://en.wikipedia.org/wiki/Hygiene“ title=„Hygiene“>Hygiene</a><ul><li><a href=„https://en.wikipedia.org/wiki/Food_safety“ title=„Food safety“>Food safety</a></li><li><a href=„https://en.wikipedia.org/wiki/Hand_washing“ title=„Hand washing“>Hand washing</a></li><li><a href=„https://en.wikipedia.org/wiki/Infection_control“ class=„mw-redirect“ title=„Infection control“>Infection control</a></li><li><a href=„https://en.wikipedia.org/wiki/Oral_hygiene“ title=„Oral hygiene“>Oral hygiene</a></li></ul></li><li><a href=„https://en.wikipedia.org/wiki/Occupational_safety_and_health“ title=„Occupational safety and health“>Occupational safety and health</a><ul><li><a href=„https://en.wikipedia.org/wiki/Human_factors_and_ergonomics“ class=„mw-redirect“ title=„Human factors and ergonomics“>Human factors and ergonomics</a></li><li><a href=„https://en.wikipedia.org/wiki/Occupational_hygiene“ title=„Occupational hygiene“>Hygiene</a></li><li><a href=„https://en.wikipedia.org/wiki/Drug_policy“ title=„Drug policy“>Controlled Drugs</a></li><li><a href=„https://en.wikipedia.org/wiki/Injury_prevention“ title=„Injury prevention“>Injury prevention</a></li><li><a href=„https://en.wikipedia.org/wiki/Occupational_medicine“ title=„Occupational medicine“>Medicine</a></li><li><a href=„https://en.wikipedia.org/wiki/Occupational_health_nursing“ title=„Occupational health nursing“>Nursing</a></li></ul></li><li><a href=„https://en.wikipedia.org/wiki/Patient_safety“ title=„Patient safety“>Patient safety</a><ul><li><a href=„https://en.wikipedia.org/wiki/Patient_safety_organization“ title=„Patient safety organization“>Organization</a></li></ul></li><li><a href=„https://en.wikipedia.org/wiki/Pharmacovigilance“ title=„Pharmacovigilance“>Pharmacovigilance</a></li><li><a href=„https://en.wikipedia.org/wiki/Safe_sex“ title=„Safe sex“>Safe sex</a></li><li><a href=„https://en.wikipedia.org/wiki/Sanitation“ title=„Sanitation“>Sanitation</a><ul><li><a href=„https://en.wikipedia.org/wiki/Emergency_sanitation“ title=„Emergency sanitation“>Emergency</a></li><li><a href=„https://en.wikipedia.org/wiki/Fecal%E2%80%93oral_route“ title=„Fecal–oral route“>Fecal–oral transmission</a></li><li><a href=„https://en.wikipedia.org/wiki/Open_defecation“ title=„Open defecation“>Open defecation</a></li><li><a href=„https://en.wikipedia.org/wiki/Sanitary_sewer“ title=„Sanitary sewer“>Sanitary sewer</a></li><li><a href=„https://en.wikipedia.org/wiki/Waterborne_diseases“ class=„mw-redirect“ title=„Waterborne diseases“>Waterborne diseases</a></li><li><a href=„https://en.wikipedia.org/wiki/Sanitation_worker“ title=„Sanitation worker“>Worker</a></li></ul></li><li><a href=„https://en.wikipedia.org/wiki/School_hygiene“ title=„School hygiene“>School hygiene</a></li><li><a href=„https://en.wikipedia.org/wiki/Smoking_cessation“ title=„Smoking cessation“>Smoking cessation</a></li><li><a href=„https://en.wikipedia.org/wiki/Vaccination“ title=„Vaccination“>Vaccination</a></li><li><a href=„https://en.wikipedia.org/wiki/Vector_control“ title=„Vector control“>Vector control</a></li></ul></div></td></tr><tr><th scope=„row“ class=„navbox-group“><a href=„https://en.wikipedia.org/wiki/Population_health“ title=„Population health“>Population health</a></th><td class=„navbox-list-with-group navbox-list navbox-odd“><div><ul><li><a href=„https://en.wikipedia.org/wiki/Biostatistics“ title=„Biostatistics“>Biostatistics</a></li><li><a href=„https://en.wikipedia.org/wiki/Child_mortality“ title=„Child mortality“>Child mortality</a></li><li><a href=„https://en.wikipedia.org/wiki/Community_health“ title=„Community health“>Community health</a></li><li><a href=„https://en.wikipedia.org/wiki/Epidemiology“ title=„Epidemiology“>Epidemiology</a></li><li><a href=„https://en.wikipedia.org/wiki/Global_health“ title=„Global health“>Global health</a></li><li><a href=„https://en.wikipedia.org/wiki/Health_impact_assessment“ title=„Health impact assessment“>Health impact assessment</a></li><li><a href=„https://en.wikipedia.org/wiki/Health_system“ title=„Health system“>Health system</a></li><li><a href=„https://en.wikipedia.org/wiki/Infant_mortality“ title=„Infant mortality“>Infant mortality</a></li><li><a href=„https://en.wikipedia.org/wiki/List_of_open-source_health_software“ title=„List of open-source health software“>Open-source healthcare software</a></li><li><a href=„https://en.wikipedia.org/wiki/Multimorbidity“ title=„Multimorbidity“>Multimorbidity</a></li><li><a href=„https://en.wikipedia.org/wiki/Public_health_informatics“ title=„Public health informatics“>Public health informatics</a></li><li><a href=„https://en.wikipedia.org/wiki/Social_determinants_of_health“ title=„Social determinants of health“>Social determinants of health</a><ul><li><a href=„https://en.wikipedia.org/wiki/Commercial_determinants_of_health“ title=„Commercial determinants of health“>Commercial determinants of health</a></li><li><a href=„https://en.wikipedia.org/wiki/Health_equity“ title=„Health equity“>Health equity</a></li><li><a href=„https://en.wikipedia.org/wiki/Race_and_health“ title=„Race and health“>Race and health</a></li></ul></li><li><a href=„https://en.wikipedia.org/wiki/Social_medicine“ title=„Social medicine“>Social medicine</a></li></ul></div></td></tr><tr><th scope=„row“ class=„navbox-group“>Biological and<br />epidemiological statistics</th><td class=„navbox-list-with-group navbox-list navbox-even“><div><ul><li><a href=„https://en.wikipedia.org/wiki/Case%E2%80%93control_study“ title=„Case–control study“>Case–control study</a></li><li><a href=„https://en.wikipedia.org/wiki/Randomized_controlled_trial“ title=„Randomized controlled trial“>Randomized controlled trial</a></li><li><a href=„https://en.wikipedia.org/wiki/Relative_risk“ title=„Relative risk“>Relative risk</a></li><li><a href=„https://en.wikipedia.org/wiki/Statistical_hypothesis_testing“ class=„mw-redirect“ title=„Statistical hypothesis testing“>Statistical hypothesis testing</a><ul><li><a href=„https://en.wikipedia.org/wiki/Analysis_of_variance“ title=„Analysis of variance“>Analysis of variance (ANOVA)</a></li><li><a href=„https://en.wikipedia.org/wiki/Regression_analysis“ title=„Regression analysis“>Regression analysis</a></li><li><a href=„https://en.wikipedia.org/wiki/ROC_curve“ class=„mw-redirect“ title=„ROC curve“>ROC curve</a></li><li><a class=„mw-selflink selflink“>Student's <i>t</i>-test</a></li><li><a href=„https://en.wikipedia.org/wiki/Z-test“ title=„Z-test“><i>Z</i>-test</a></li></ul></li><li><a href=„https://en.wikipedia.org/wiki/List_of_statistical_packages“ class=„mw-redirect“ title=„List of statistical packages“>Statistical software</a></li></ul></div></td></tr><tr><th scope=„row“ class=„navbox-group“>Infectious and epidemic<br />disease prevention</th><td class=„navbox-list-with-group navbox-list navbox-odd“><div><ul><li><a href=„https://en.wikipedia.org/wiki/Asymptomatic_carrier“ title=„Asymptomatic carrier“>Asymptomatic carrier</a></li><li><a href=„https://en.wikipedia.org/wiki/Epidemic“ title=„Epidemic“>Epidemics</a><ul><li><a href=„https://en.wikipedia.org/wiki/List_of_epidemics_and_pandemics“ title=„List of epidemics and pandemics“>List</a></li></ul></li><li><a href=„https://en.wikipedia.org/wiki/Notifiable_disease“ title=„Notifiable disease“>Notifiable diseases</a><ul><li><a href=„https://en.wikipedia.org/wiki/List_of_notifiable_diseases“ title=„List of notifiable diseases“>List</a></li></ul></li><li><a href=„https://en.wikipedia.org/wiki/Public_health_surveillance“ title=„Public health surveillance“>Public health surveillance</a><ul><li><a href=„https://en.wikipedia.org/wiki/Disease_surveillance“ title=„Disease surveillance“>Disease surveillance</a></li></ul></li><li><a href=„https://en.wikipedia.org/wiki/Quarantine“ title=„Quarantine“>Quarantine</a></li><li><a href=„https://en.wikipedia.org/wiki/Sexually_transmitted_infection“ title=„Sexually transmitted infection“>Sexually transmitted infection</a></li><li><a href=„https://en.wikipedia.org/wiki/Social_distancing“ title=„Social distancing“>Social distancing</a></li><li><a href=„https://en.wikipedia.org/wiki/Tropical_disease“ title=„Tropical disease“>Tropical disease</a></li><li><a href=„https://en.wikipedia.org/wiki/Vaccine_trial“ title=„Vaccine trial“>Vaccine trial</a></li></ul></div></td></tr><tr><th scope=„row“ class=„navbox-group“>Food hygiene and<br />safety management</th><td class=„navbox-list-with-group navbox-list navbox-even“><div><ul><li>Food<ul><li><a href=„https://en.wikipedia.org/wiki/Food_additive“ title=„Food additive“>Additive</a></li><li><a href=„https://en.wikipedia.org/wiki/Food_chemistry“ title=„Food chemistry“>Chemistry</a></li><li><a href=„https://en.wikipedia.org/wiki/Food_engineering“ title=„Food engineering“>Engineering</a></li><li><a href=„https://en.wikipedia.org/wiki/Food_microbiology“ title=„Food microbiology“>Microbiology</a></li><li><a href=„https://en.wikipedia.org/wiki/Food_processing“ title=„Food processing“>Processing</a></li><li><a href=„https://en.wikipedia.org/wiki/Food_safety“ title=„Food safety“>Safety</a></li><li><a href=„https://en.wikipedia.org/wiki/Category:Food_safety_scandals“ title=„Category:Food safety scandals“>Safety scandals</a></li></ul></li><li><a href=„https://en.wikipedia.org/wiki/Genetically_modified_food“ title=„Genetically modified food“>Genetically modified food</a></li><li><a href=„https://en.wikipedia.org/wiki/Good_agricultural_practice“ title=„Good agricultural practice“>Good agricultural practice</a></li><li><a href=„https://en.wikipedia.org/wiki/Good_manufacturing_practice“ title=„Good manufacturing practice“>Good manufacturing practice</a><ul><li><a href=„https://en.wikipedia.org/wiki/HACCP“ class=„mw-redirect“ title=„HACCP“>HACCP</a></li><li><a href=„https://en.wikipedia.org/wiki/ISO_22000“ title=„ISO 22000“>ISO 22000</a></li></ul></li></ul></div></td></tr><tr><th scope=„row“ class=„navbox-group“>Health behavioral<br />sciences</th><td class=„navbox-list-with-group navbox-list navbox-odd“><div><ul><li><a href=„https://en.wikipedia.org/wiki/Diffusion_of_innovations“ title=„Diffusion of innovations“>Diffusion of innovations</a></li><li><a href=„https://en.wikipedia.org/wiki/Health_belief_model“ title=„Health belief model“>Health belief model</a></li><li><a href=„https://en.wikipedia.org/wiki/Health_communication“ title=„Health communication“>Health communication</a></li><li><a href=„https://en.wikipedia.org/wiki/Health_psychology“ title=„Health psychology“>Health psychology</a></li><li><a href=„https://en.wikipedia.org/wiki/Positive_deviance“ title=„Positive deviance“>Positive deviance</a></li><li><a href=„https://en.wikipedia.org/wiki/PRECEDE%E2%80%93PROCEED_model“ title=„PRECEDE–PROCEED model“>PRECEDE–PROCEED model</a></li><li><a href=„https://en.wikipedia.org/wiki/Social_cognitive_theory“ title=„Social cognitive theory“>Social cognitive theory</a></li><li><a href=„https://en.wikipedia.org/wiki/Social_norms_approach“ title=„Social norms approach“>Social norms approach</a></li><li><a href=„https://en.wikipedia.org/wiki/Theory_of_planned_behavior“ title=„Theory of planned behavior“>Theory of planned behavior</a></li><li><a href=„https://en.wikipedia.org/wiki/Transtheoretical_model“ title=„Transtheoretical model“>Transtheoretical model</a></li></ul></div></td></tr><tr><th scope=„row“ class=„navbox-group“>Organizations,<br />education<br />and history</th><td class=„navbox-list-with-group navbox-list navbox-odd“><table class=„nowraplinks navbox-subgroup“><tbody><tr><th scope=„row“ class=„navbox-group“>Organizations</th><td class=„navbox-list-with-group navbox-list navbox-even“><div><ul><li>Caribbean<ul><li><a href=„https://en.wikipedia.org/wiki/Caribbean_Public_Health_Agency“ title=„Caribbean Public Health Agency“>Caribbean Public Health Agency</a></li></ul></li><li>China<ul><li><a href=„https://en.wikipedia.org/wiki/Chinese_Center_for_Disease_Control_and_Prevention“ title=„Chinese Center for Disease Control and Prevention“>Center for Disease Control and Prevention</a></li></ul></li><li>Europe<ul><li><a href=„https://en.wikipedia.org/wiki/European_Centre_for_Disease_Prevention_and_Control“ title=„European Centre for Disease Prevention and Control“>Centre for Disease Prevention and Control</a></li><li><a href=„https://en.wikipedia.org/wiki/European_Parliament_Committee_on_the_Environment,_Public_Health_and_Food_Safety“ title=„European Parliament Committee on the Environment, Public Health and Food Safety“>Committee on the Environment, Public Health and Food Safety</a></li></ul></li><li>India<ul><li><a href=„https://en.wikipedia.org/wiki/Ministry_of_Health_and_Family_Welfare“ title=„Ministry of Health and Family Welfare“>Ministry of Health and Family Welfare</a></li></ul></li><li>Canada<ul><li><a href=„https://en.wikipedia.org/wiki/Health_Canada“ title=„Health Canada“>Health Canada</a></li><li><a href=„https://en.wikipedia.org/wiki/Public_Health_Agency_of_Canada“ title=„Public Health Agency of Canada“>Public Health Agency</a></li></ul></li><li>U.S.<ul><li><a href=„https://en.wikipedia.org/wiki/Centers_for_Disease_Control_and_Prevention“ title=„Centers for Disease Control and Prevention“>Centers for Disease Control and Prevention</a></li><li><a href=„https://en.wikipedia.org/wiki/Health_departments_in_the_United_States“ title=„Health departments in the United States“>Health departments in the United States</a></li><li><a href=„https://en.wikipedia.org/wiki/Council_on_Education_for_Public_Health“ title=„Council on Education for Public Health“>Council on Education for Public Health</a></li><li><a href=„https://en.wikipedia.org/wiki/United_States_Public_Health_Service“ title=„United States Public Health Service“>Public Health Service</a></li></ul></li><li><a href=„https://en.wikipedia.org/wiki/World_Health_Organization“ title=„World Health Organization“>World Health Organization</a></li><li><a href=„https://en.wikipedia.org/wiki/World_Toilet_Organization“ title=„World Toilet Organization“>World Toilet Organization</a></li><li>(<a href=„https://en.wikipedia.org/wiki/List_of_national_public_health_agencies“ title=„List of national public health agencies“>Full list</a>)</li></ul></div></td></tr><tr><th scope=„row“ class=„navbox-group“>Education</th><td class=„navbox-list-with-group navbox-list navbox-odd“><div><ul><li><a href=„https://en.wikipedia.org/wiki/Health_education“ title=„Health education“>Health education</a></li><li>Higher education<ul><li><a href=„https://en.wikipedia.org/wiki/Bachelor_of_Science_in_Public_Health“ title=„Bachelor of Science in Public Health“>Bachelor of Science in Public Health</a></li><li><a href=„https://en.wikipedia.org/wiki/Doctor_of_Public_Health“ title=„Doctor of Public Health“>Doctor of Public Health</a></li><li><a href=„https://en.wikipedia.org/wiki/Professional_degrees_of_public_health“ title=„Professional degrees of public health“>Professional degrees of public health</a></li><li><a href=„https://en.wikipedia.org/wiki/Category:Schools_of_public_health“ title=„Category:Schools of public health“>Schools of public health</a></li></ul></li></ul></div></td></tr><tr><th scope=„row“ class=„navbox-group“>History</th><td class=„navbox-list-with-group navbox-list navbox-even“><div><ul><li><a href=„https://en.wikipedia.org/wiki/Sara_Josephine_Baker“ title=„Sara Josephine Baker“>Sara Josephine Baker</a></li><li><a href=„https://en.wikipedia.org/wiki/Samuel_Jay_Crumbine“ title=„Samuel Jay Crumbine“>Samuel Jay Crumbine</a></li><li><a href=„https://en.wikipedia.org/wiki/Carl_Rogers_Darnall“ title=„Carl Rogers Darnall“>Carl Rogers Darnall</a></li><li><a href=„https://en.wikipedia.org/wiki/Joseph_Lister“ title=„Joseph Lister“>Joseph Lister</a></li><li><a href=„https://en.wikipedia.org/wiki/Margaret_Sanger“ title=„Margaret Sanger“>Margaret Sanger</a></li><li><a href=„https://en.wikipedia.org/wiki/John_Snow_(physician)“ class=„mw-redirect“ title=„John Snow (physician)“>John Snow</a></li><li><a href=„https://en.wikipedia.org/wiki/Mary_Mallon“ title=„Mary Mallon“>Typhoid Mary</a></li><li><a href=„https://en.wikipedia.org/wiki/Radium_Girls“ title=„Radium Girls“>Radium Girls</a></li><li><a href=„https://en.wikipedia.org/wiki/Germ_theory_of_disease“ title=„Germ theory of disease“>Germ theory of disease</a></li><li><a href=„https://en.wikipedia.org/wiki/Social_hygiene_movement“ title=„Social hygiene movement“>Social hygiene movement</a></li></ul></div></td></tr></tbody></table></td></tr><tr><td class=„navbox-abovebelow“ colspan=„2“><div><ul><li><img alt=„“ src=„https://upload.wikimedia.org/wikipedia/en/thumb/9/96/Symbol_category_class.svg/16px-Symbol_category_class.svg.png“ width=„16“ height=„16“ class=„mw-file-element“ srcset=„upload.wikimedia.org/wikipedia/en/thumb/9/96/Symbol_category_class.svg/23px-Symbol_category_class.svg.png 1.5x, upload.wikimedia.org/wikipedia/en/thumb/9/96/Symbol_category_class.svg/31px-Symbol_category_class.svg.png 2x“ data-file-width=„180“ data-file-height=„185“ referrerpolicy=„no-referrer“ /><b><a href=„https://en.wikipedia.org/wiki/Category:Public_health“ title=„Category:Public health“>Category</a></b></li><li><img alt=„“ src=„https://upload.wikimedia.org/wikipedia/en/thumb/4/4a/Commons-logo.svg/12px-Commons-logo.svg.png“ width=„12“ height=„16“ class=„mw-file-element“ srcset=„upload.wikimedia.org/wikipedia/en/thumb/4/4a/Commons-logo.svg/18px-Commons-logo.svg.png 1.5x, upload.wikimedia.org/wikipedia/en/thumb/4/4a/Commons-logo.svg/24px-Commons-logo.svg.png 2x“ data-file-width=„1024“ data-file-height=„1376“ referrerpolicy=„no-referrer“ /><b><a href=„https://commons.wikimedia.org/wiki/Category:Public_health“ class=„extiw“ title=„commons:Category:Public health“>Commons</a></b></li><li><img alt=„“ src=„https://upload.wikimedia.org/wikipedia/commons/thumb/3/37/People_icon.svg/16px-People_icon.svg.png“ width=„16“ height=„16“ class=„mw-file-element“ srcset=„upload.wikimedia.org/wikipedia/commons/thumb/3/37/People_icon.svg/24px-People_icon.svg.png 1.5x, upload.wikimedia.org/wikipedia/commons/thumb/3/37/People_icon.svg/32px-People_icon.svg.png 2x“ data-file-width=„100“ data-file-height=„100“ referrerpolicy=„no-referrer“ /><b><a href=„https://en.wikipedia.org/wiki/Wikipedia:WikiProject_Nursing“ title=„Wikipedia:WikiProject Nursing“>WikiProject</a></b></li></ul></div></td></tr></tbody></table></div><div class=„navbox-styles“><link rel=„mw-deduplicated-inline-style“ href=„denied:mw-data:TemplateStyles:r1129693374“ /><link rel=„mw-deduplicated-inline-style“ href=„denied:mw-data:TemplateStyles:r1228936124“ /></div><div role=„navigation“ class=„navbox authority-control“ aria-label=„Navbox“><table class=„nowraplinks hlist navbox-inner“><tbody><tr><th scope=„row“ class=„navbox-group“><a href=„https://en.wikipedia.org/wiki/Help:Authority_control“ title=„Help:Authority control“>Authority control databases</a>: National <a href=„https://www.wikidata.org/wiki/Q309479#identifiers“ title=„Edit this at Wikidata“><img alt=„Edit this at Wikidata“ src=„https://upload.wikimedia.org/wikipedia/en/thumb/8/8a/OOjs_UI_icon_edit-ltr-progressive.svg/10px-OOjs_UI_icon_edit-ltr-progressive.svg.png“ width=„10“ height=„10“ class=„mw-file-element“ srcset=„upload.wikimedia.org/wikipedia/en/thumb/8/8a/OOjs_UI_icon_edit-ltr-progressive.svg/15px-OOjs_UI_icon_edit-ltr-progressive.svg.png 1.5x, upload.wikimedia.org/wikipedia/en/thumb/8/8a/OOjs_UI_icon_edit-ltr-progressive.svg/20px-OOjs_UI_icon_edit-ltr-progressive.svg.png 2x“ data-file-width=„20“ data-file-height=„20“ referrerpolicy=„no-referrer“ /></a></th><td class=„navbox-list-with-group navbox-list navbox-odd“><div><ul><li><a rel=„nofollow“ class=„external text“ href=„https://d-nb.info/gnd/4420602-1“>Germany</a></li></ul></div></td></tr></tbody></table></div></dd></dl></div><noscript><img src=„https://login.wikimedia.org/wiki/Special:CentralAutoLogin/start?type=1x1“ alt=„“ width=„1“ height=„1“ referrerpolicy=„no-referrer“ /></noscript><div class=„printfooter“ data-nosnippet=„“>Retrieved from „<a dir=„ltr“ href=„https://en.wikipedia.org/w/index.php?title=Student%27s_t-test&oldid=1224247091“>https://en.wikipedia.org/w/index.php?title=Student%27s_t-test&oldid=1224247091</a>“</div></div>
</html>
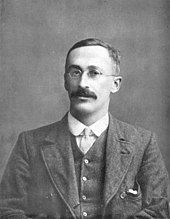
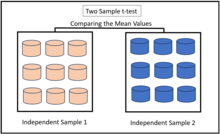
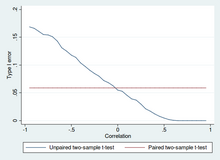
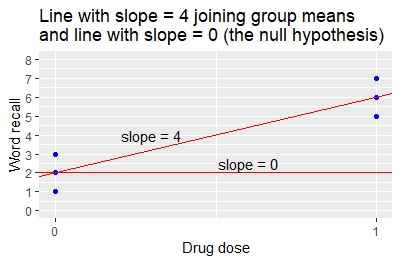